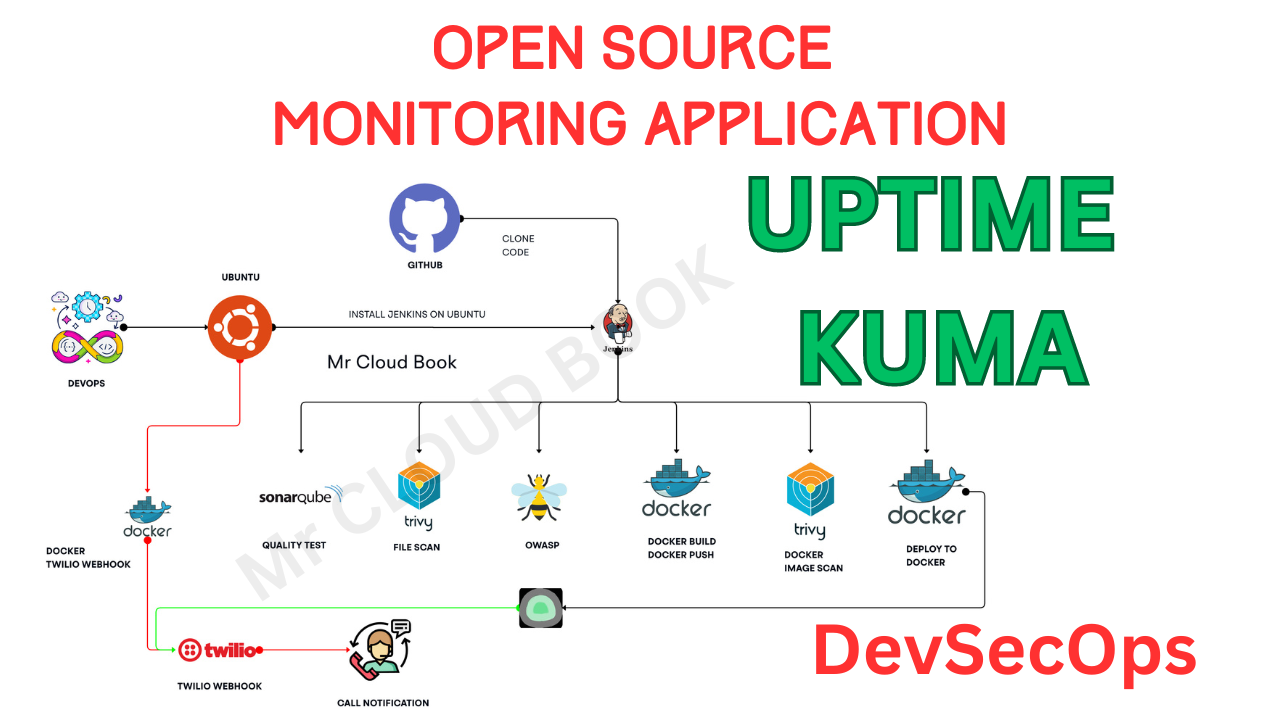
Uptime-Kuma is an open-source self-hosted monitoring tool that provides a sleek interface to track the uptime of websites, services, and APIs. When integrated into a CI/CD pipeline for a blog, it helps ensure continuous availability and performance monitoring. Here’s a detailed explanation of how Uptime-Kuma can be utilized effectively in this context:
What is Uptime-Kuma?
- Overview: Uptime-Kuma is a self-hosted monitoring tool designed to track the uptime and performance of websites, services, and APIs.
- Features:
Real-time monitoring with customizable intervals.
- Alerts via multiple channels (email, Slack, Telegram, etc.).
- Historical data and uptime statistics.
- Sleek, user-friendly interface.
Now, let’s get started and dig deeper into each of these steps:-
1. AWS Account and Login
- If you don’t have an AWS account, sign up at AWS Sign Up.
- Log in to the AWS Management Console.
2. Launch an EC2 Instance
A. Navigate to EC2 Dashboard:
- Go to the EC2 Dashboard.
B. Choose an Amazon Machine Image (AMI):
- Click “Launch Instance.”
- In the AMI selection screen, search for “Ubuntu 24.04”.
C. Choose an Instance Type:
- Select the
t2.largeinstance type. - Click “Next: Configure Instance Details.”
D. Configure Instance Details:
- Use the default settings.
- Ensure you have selected the correct VPC and subnet.
- Click “Next: Add Storage.”
E. Add Storage:
- Modify the root volume size to 30 GB.
- Click “Next: Add Tags.”
F. Add Tags:
- (Optional) Add tags for better management.
- Click “Next: Configure Security Group.”
G. Configure Security Group:
- Create a new security group.
- Set the security group name and description.
- Add a rule to allow all traffic (not recommended for production environments):
Type: All Traffic
- Protocol: All
- Port Range: All
- Port Range : 22, 80, 443, 8080, 9000, 3001, 5000
- Source: 0.0.0.0/0 (for IPv4) and ::/0 (for IPv6)
Warning: Opening all ports is insecure and should only be done for learning purposes in a controlled environment.
Click “Review and Launch.”
H. Review Instance Launch:
- Review all configurations.
- Click “Launch.”
I. Select/Create a Key Pair:
- Select “Create a new key pair.”
- Name the key pair.
- Download the key pair file (.pem) and store it securely.
- Click “Launch Instances.”

Install Jenkins, Docker and Trivy
To Install Jenkins
Connect to your console, and enter these commands to Install Jenkins
vi jenkins.sh
#!/bin/bash
sudo apt update -y
wget -O - https://packages.adoptium.net/artifactory/api/gpg/key/public | sudo tee /etc/apt/keyrings/adoptium.asc
echo "deb [signed-by=/etc/apt/keyrings/adoptium.asc] https://packages.adoptium.net/artifactory/deb $(awk -F= '/^VERSION_CODENAME/{print$2}' /etc/os-release) main" | sudo tee /etc/apt/sources.list.d/adoptium.list
sudo apt update -y
sudo apt install temurin-17-jdk -y
/usr/bin/java --version
curl -fsSL https://pkg.jenkins.io/debian-stable/jenkins.io-2023.key | sudo tee /usr/share/keyrings/jenkins-keyring.asc > /dev/null
echo deb [signed-by=/usr/share/keyrings/jenkins-keyring.asc] https://pkg.jenkins.io/debian-stable binary/ | sudo tee /etc/apt/sources.list.d/jenkins.list > /dev/null
sudo apt-get update -y
sudo apt-get install jenkins -y
sudo systemctl start jenkins
sudo systemctl status jenkins
sudo chmod 777 jenkins.sh
sudo su   #move into root and run
./jenkins.sh    # this will installl jenkins
Once Jenkins is installed, you will need to go to your AWS EC2 Security Group and open Inbound Port 8080, since Jenkins works on Port 8080.
Now, grab your Public IP Address
EC2 Public IP Address:8080
# In Jenkins server
sudo cat /var/lib/jenkins/secrets/initialAdminPassword

Unlock Jenkins using an administrative password and install the suggested plugins.

Jenkins will now get installed and install all the libraries.

Create a user click on save and continue.
Jenkins Getting Started Screen.

Install Docker
# Add Docker's official GPG key:
sudo apt-get update
sudo apt-get install ca-certificates curl
sudo install -m 0755 -d /etc/apt/keyrings
sudo curl -fsSL https://download.docker.com/linux/ubuntu/gpg -o /etc/apt/keyrings/docker.asc
sudo chmod a+r /etc/apt/keyrings/docker.asc
# Add the repository to Apt sources:
echo \
  "deb [arch=$(dpkg --print-architecture) signed-by=/etc/apt/keyrings/docker.asc] https://download.docker.com/linux/ubuntu \
  $(. /etc/os-release && echo "$VERSION_CODENAME") stable" | \
  sudo tee /etc/apt/sources.list.d/docker.list > /dev/null
sudo apt-get update
sudo apt-get install docker-ce docker-ce-cli containerd.io docker-buildx-plugin docker-compose-plugin -y
sudo usermod -aG docker ubuntu
newgrp docker
sudo chmod 777 /var/run/docker.sock
After the docker installation, we create a sonarqube container (Remember to add 9000 ports in the security group).
sudo chmod 777 /var/run/docker.sock
docker run -d --name sonar -p 9000:9000 sonarqube:lts-community

Now our Sonarqube is up and running

Enter username and password, click on login and change password
username admin
password admin

Update New password, This is Sonar Dashboard.

Install Trivy
vi script.sh
sudo apt-get install wget apt-transport-https gnupg lsb-release -y
wget -qO - https://aquasecurity.github.io/trivy-repo/deb/public.key | gpg --dearmor | sudo tee /usr/share/keyrings/trivy.gpg > /dev/null
echo "deb [signed-by=/usr/share/keyrings/trivy.gpg] https://aquasecurity.github.io/trivy-repo/deb $(lsb_release -sc) main" | sudo tee -a /etc/apt/sources.list.d/trivy.list
sudo apt-get update
sudo apt-get install trivy -y
Give permissions and run script
sudo chmod 777 script.sh
./script.sh
Next, we will log in to Jenkins and start to configure our Pipeline in Jenkins
Install Plugins like JDK, Sonarqube Scanner, NodeJs, OWASP Dependency Check
Install Plugin
Goto Manage Jenkins →Plugins → Available Plugins →
Install below plugins
Blue ocean
1 → Eclipse Temurin Installer
2 → SonarQube Scanner
3 → NodeJs Plugin
4 → Docker
5 → Docker commons
6 → Docker pipeline
7 → Docker API
8 → Docker Build step
9 → Owasp Dependency Check

Configure Java and Nodejs in Global Tool Configuration
Goto Manage Jenkins → Tools → Install JDK(17) and NodeJs(18)→ Click on Apply and Save


Grab the Public IP Address of your EC2 Instance, Sonarqube works on Port 9000, so
Click on Administration → Security → Users → Click on Tokens and Update Token → Give it a name → and click on Generate Token

click on update Token

Create a token with a name and generate

copy Token
Go to Jenkins Dashboard → Manage Jenkins → Credentials → Add Secret Text. It should look like this

You will this page once you click on create

Now, go to Dashboard → Manage Jenkins → System and Add like the below image.
Search for SonarQube Installation

Click on Apply and Save
The Configure System option is used in Jenkins to configure different server
Global Tool Configuration is used to configure different tools that we install using Plugins
We will install a sonar scanner in the tools.
Manage Jenkins -> Tools -> SonarQube Scanner

In the Sonarqube Dashboard add a quality gate also
Administration-> Configuration->Webhooks

Click on Create

Add details
#in url section of quality gate
http://jenkins-public-ip:8080/sonarqube-webhook/

First, we configured the Plugin and next, we had to configure the Tool
Goto Dashboard → Manage Jenkins → Tools →Dependency-Check & Docker

Go to manage Jenkins -> Credentials
Add DockerHub Username and Password under Global Credentials

Create Job for Uptime-kuma
Add this stage to Pipeline Script
pipeline{
    agent any
    tools{
        jdk 'jdk17'
        nodejs 'node18'
    }
    environment {
        SCANNER_HOME=tool 'sonar-scanner'
    }
    stages {
        stage('Checkout from Git'){
            steps{
                git branch: 'main', url: 'https://github.com/Aj7Ay/uptime.git'
            }
        }
        stage('Install Dependencies') {
            steps {
                sh "npm install"
            }
        }
        stage("Sonarqube Analysis "){
            steps{
                withSonarQubeEnv('sonar-server') {
                    sh ''' $SCANNER_HOME/bin/sonar-scanner -Dsonar.projectName=uptime \
                    -Dsonar.projectKey=uptime '''
                }
            }
        }
        stage("quality gate"){
           steps {
                script {
                    waitForQualityGate abortPipeline: false, credentialsId: 'Sonar-token'
                }
            }
        }
        stage('OWASP FS SCAN') {
            steps {
                dependencyCheck additionalArguments: '--scan ./ --disableYarnAudit --disableNodeAudit', odcInstallation: 'DP-Check'
                dependencyCheckPublisher pattern: '**/dependency-check-report.xml'
            }
        }
        stage('TRIVY FS SCAN') {
            steps {
                sh "trivy fs . > trivyfs.json"
            }
        }
        stage("Docker Build & Push"){
            steps{
                script{
                   withDockerRegistry(credentialsId: 'docker', toolName: 'docker'){
                       sh "docker build -t uptime ."
                       sh "docker tag uptime sevenajay/uptime:latest "
                       sh "docker push sevenajay/uptime:latest "
                    }
                }
            }
        }
        stage("TRIVY"){
            steps{
                sh "trivy image sevenajay/uptime:latest > trivy.json"
            }
        }
        stage ("Remove container") {
            steps{
                sh "docker stop uptime | true"
                sh "docker rm uptime | true"
             }
        }
        stage('Deploy to container'){
            steps{
                sh 'docker run -d --name chatbot -v /var/run/docker.sock:/var/run/docker.sock -p 3001:3001 sevenajay/uptime:latest'
            }
        }
    }
Git checkout

Tool install

Git pull

NPM install

Sonarqube analysis


Quality Gate

Owasp

Trivy FS

Docker Build and push

Trivy Image scan and deploy to Docker

Copy the Public of Server
public-ip>:30001
Output Login Page

Output

Twilio webhook setup
Clone the Github Repo
git clone https://github.com/Aj7Ay/Uptime-kuma.git
cd Uptime-kuma
cd Webhook
Create an Twilio Account From Here
Go to Console
copy Account SID & Account Auth Token and Mobile Number

Update the app.py
from flask import Flask
from twilio.rest import Client

app = Flask(__name__)

@app.route('/trigger-calls', methods=['GET', 'POST'])
def trigger_call():
    account_sid = ''
    auth_token = ''
    client = Client(account_sid, auth_token)

    # List of numbers to call
    numbers_to_call = ['', '']
    call_sid = []  # To store Call SIDs

    for number in numbers_to_call:
        call = client.calls.create(
                            twim='"change Alert message here"',
                            to=number,
                            from_=''
                        )
        call_sids.append(call.sid)

    # Joining all the Call SIDs to return in response
    call_sids_str = ', 'join(call_sids)
    return f"Call initiated with SIDs: {call_sids_str}", 200

if __name__ == '__main__':
    app.run(host'0.0.0.0', port=5000)
Now install These on Server
sudo apt install python3-pip
sudo apt install python3.12-venv
python3 -m venv venv
source venv/bin/activate
Now install Requirements
pip install -r requirements.txt
Create the Docker webhook
cd Uptime-kuma/webhook
docker build -t webhook .
docker run -d --name webhook -p 5000:5000 webhook:latest
webhook runs on 5000 port
Go to Uptime Kuma select Profile -> Settings
Select Notification -> setup Notification
Select Notification Type as webhook
Give Friendly name -> URL of webhook -> save
Select One service from Dashboard -> Edit
Turn on Notification to get call
You will get call when server or service Down
Remove Server at end.
Comments (1)
Hellpo
Leave a comment