Your server is slow. Something’s eating CPU or memory, and you need to see exactly what - fast. If you’ve ever stared at top and wondered what half the keys do, or switched to htop and still missed disk and network stats, you’re in the right place.
This guide is the single reference for the four tools that matter: top (the classic), htop (interactive and friendly), btop (modern and pretty), and atop (the one that remembers). You’ll get every important command and keybinding in one place - no hunting through man pages. Whether you’re debugging on a single server, writing a blog post, or prepping for an interview, you’ll know which tool to use and how to use it.
In this guide you’ll get:
- A clear comparison of top vs htop vs btop vs atop (and when to use which)
- Every command-line option and keyboard shortcut, explained
- What each column and stat means so you can read the numbers at a glance
- Ready-to-run test scenarios you can try on your own server
Overview & Comparison
| Feature |
top |
htop |
btop |
atop |
| Type |
Process list + summary |
Interactive process viewer |
Modern resource monitor |
System + process monitor with logging |
| Default on most distros |
Yes |
No (often need install) |
No |
No |
| Mouse support |
No |
Yes |
Yes |
No |
| Scroll |
Limited |
Full scroll |
Full scroll |
Limited |
| Historical data |
No |
No |
Yes (graphs) |
Yes (logged) |
| Per-CPU |
Toggle |
Always visible |
Always visible |
Toggle |
| Tree view |
No |
Yes |
Yes |
No |
| Log/replay |
No |
No |
No |
Yes |
| Disk/network |
No |
No |
Yes |
Yes |
| Best for |
Minimal, everywhere |
Day-to-day processes |
Pretty dashboards, demos |
Post-mortem, capacity planning |
1. top
What it is: The classic Unix/Linux process monitor. Available on virtually every Linux/Unix system. Shows a live summary of system state and a list of processes.
Installation
- Usually pre-installed. If not:
- Debian/Ubuntu:
sudo apt install procps
- RHEL/CentOS/Fedora:
sudo dnf install procps-ng or sudo yum install procps-ng
Starting top
top                    # Default: sort by %CPU, refresh ~3s
top -d 2               # Set delay between updates to 2 seconds
top -p 1234,5678       # Monitor only PIDs 1234 and 5678
top -u username        # Show only processes of user "username"
top -c                 # Show full command line (not just program name)
top -b -n 3            # Batch mode: 3 iterations then exit (for scripting)
top -H -p 1234         # Show threads of process 1234 (-H = thread mode)
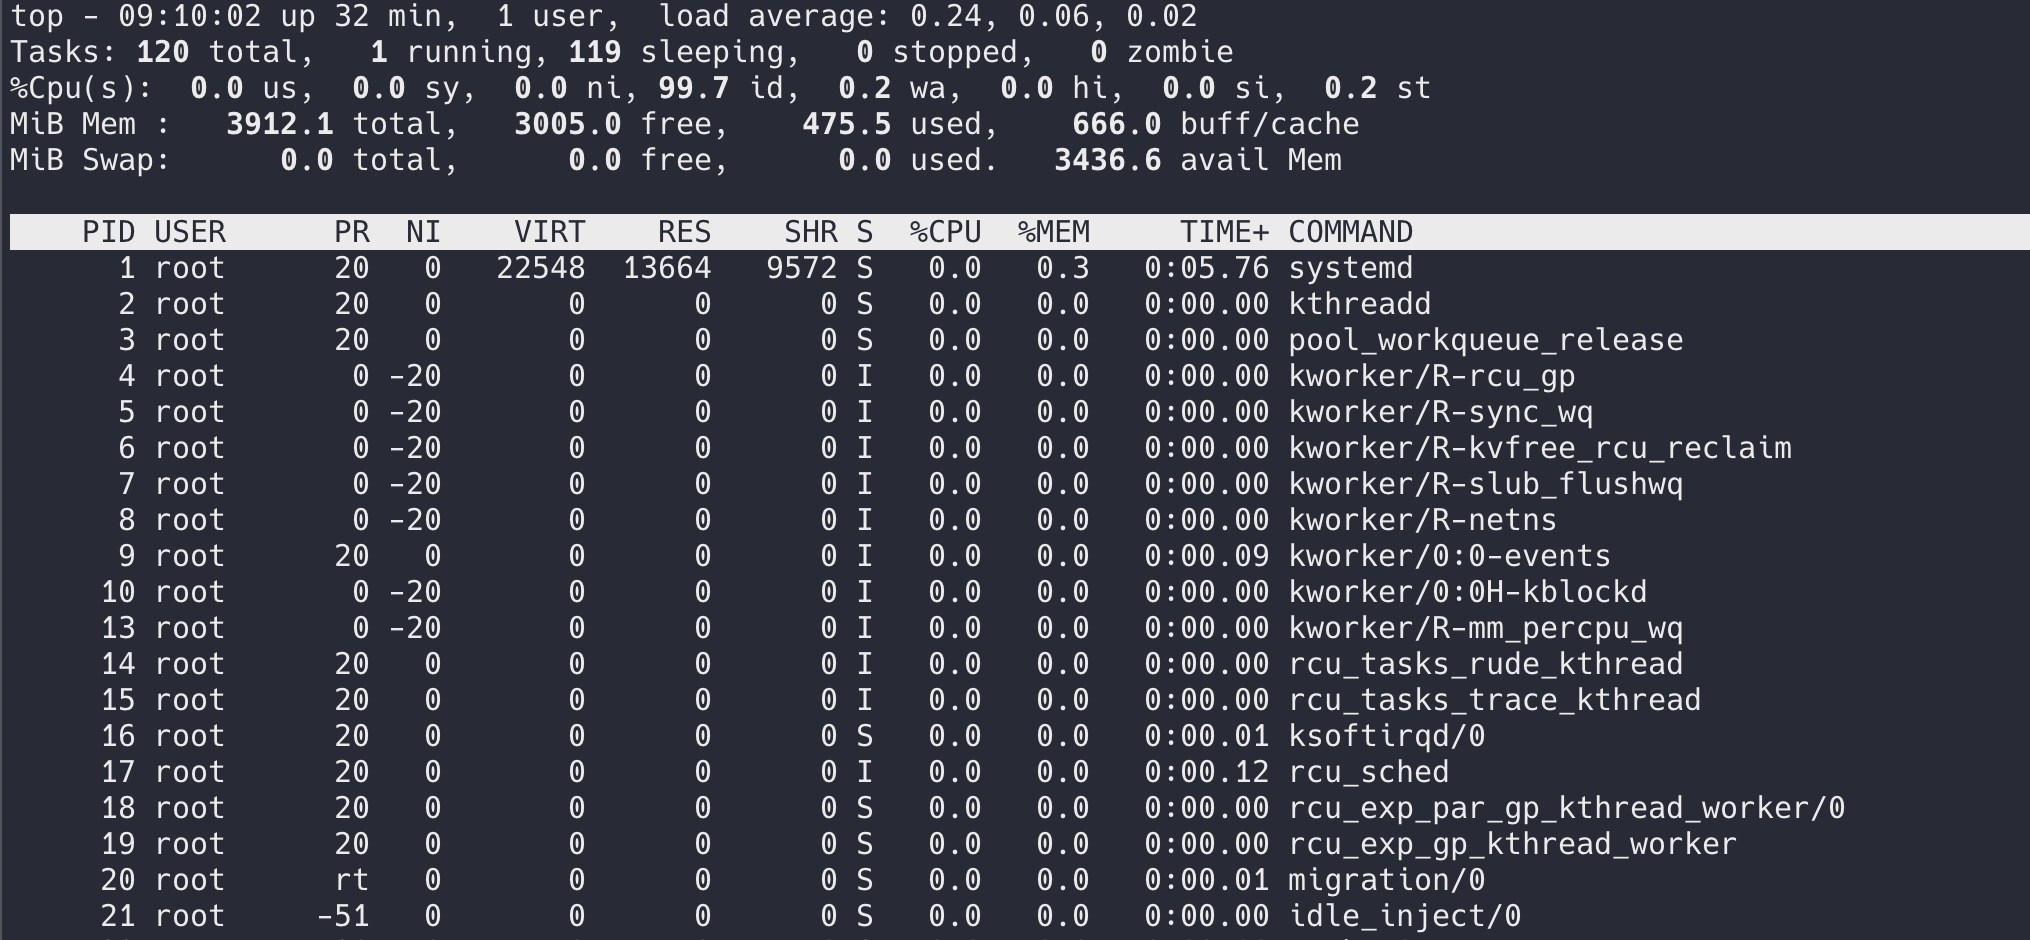
- Line 1:
top - HH:MM:SS up X days, Y users, load average: a b c
- load average: 1-, 5-, and 15-minute load averages (run queue + uninterruptible).
- Line 2: Tasks: total, running, sleeping, stopped, zombie.
- Line 3: %Cpu(s): us (user), sy (system), ni (nice), id (idle), wa (iowait), hi (hardware IRQ), si (soft IRQ), st (steal), gu (guest), gn (guest nice).
- Line 4: MiB Mem: total, free, used, buff/cache.
- Line 5: MiB Swap: total, free, used. Avail Mem = effectively free (including reclaimable cache).
Interactive commands (while top is running)
Global
| Key |
Action |
| h or ? |
Help |
| q |
Quit |
| Space |
Force update now |
| d or s |
Set delay between updates (prompt for seconds) |
| W |
Write current configuration to ~/.toprc |
| Z |
Toggle color/mono; 0-7 change color scheme |
| B |
Toggle bold in summary/header |
| l |
Toggle load average line (line 1) |
| t |
Toggle CPU stats (line 3): bar / text / both / off |
| m |
Toggle memory stats (lines 4-5): bar / text / both / off |
| 1 |
Toggle per-CPU view (one line per CPU vs. average) |
| 2 |
Same as 1 on some versions (NUMA nodes on others) |
| E |
Cycle memory scale in header: KiB → MiB → GiB → TiB → PiB |
| e |
Cycle memory scale in process list (RES, etc.) |
| x |
Toggle highlight for sort column |
| y |
Toggle highlight for running processes |
| z |
Toggle color on/off |
Sorting
| Key |
Sort by |
| P |
%CPU (default) |
| M |
%MEM (resident memory) |
| T |
TIME+ (total CPU time) |
| N |
PID (numeric) |
| n |
PID (numeric, same on many systems) |
| I |
Idle (skip idle, or toggle) |
| c |
Toggle full command line |
| S |
Cumulative time mode (parent+children) |
| V |
Forest/tree view (parent/child) |
Filtering / process selection
| Key |
Action |
| u |
Filter by user (prompt) |
| o |
Add filter (e.g. COMMAND=nginx) |
| O |
Change filter (capital O) |
| = |
Clear filter |
| L |
Locate: prompt for string, highlight matching |
| & |
Locate again (next match) |
Process (task) commands
| Key |
Action |
| k |
Kill: prompt for PID, then signal (default 15 = SIGTERM) |
| r |
Renice: prompt for PID, then nice value (-20 to 19) |
| d / s |
(if not used for delay) Set update interval |
Window/display
| Key |
Action |
| i |
Toggle idle processes (hide/show) |
| f |
Field select: choose which columns to show and sort column (use arrows, d to toggle, s to set sort) |
| F |
Same as f on some versions |
| j |
Toggle justified output for numeric columns |
| J |
Toggle right-justified numeric columns |
| A |
Toggle alternate display (4 windows: Def, Job, Mem, User) |
| g |
Switch between window 1/2/3/4 (when alternate display) |
| H |
Toggle threads (show as separate lines) |
| c |
Toggle full command line |
| W |
Write config to ~/.toprc |
Alternate display (after A)
- g then 1-4: Select which of the 4 summary lines (Def/Job/Mem/User) to show in each window.
- g then 1: Window 1 (usually default process list).
- g then 2: Job/task summary.
- g then 3: Memory region summary.
- g then 4: User summary.
Column meanings (process list)
| Column |
Meaning |
| PID |
Process ID |
| USER |
Owner of process |
| PR |
Priority (kernel view) |
| NI |
Nice value (-20 to 19) |
| VIRT |
Virtual memory (total address space) |
| RES |
Resident memory (physical RAM used) |
| SHR |
Shared memory |
| S |
State: R=Running, S=Sleeping, D=Uninterruptible, Z=Zombie, T=Stopped |
| %CPU |
CPU usage (over last interval) |
| %MEM |
% of physical RAM |
| TIME+ |
Total CPU time (cumulative) |
| COMMAND |
Command line (short or full with c) |
Tips for your blog
- Use top -b -n 1 in scripts to capture one snapshot.
- Use -p to watch specific PIDs; -u to watch one user.
- Explain load average vs. CPU count (e.g. load 4 on 4 CPU = busy; load 4 on 8 CPU = half busy).
- Show t and m to explain bar vs. text for CPU/memory.
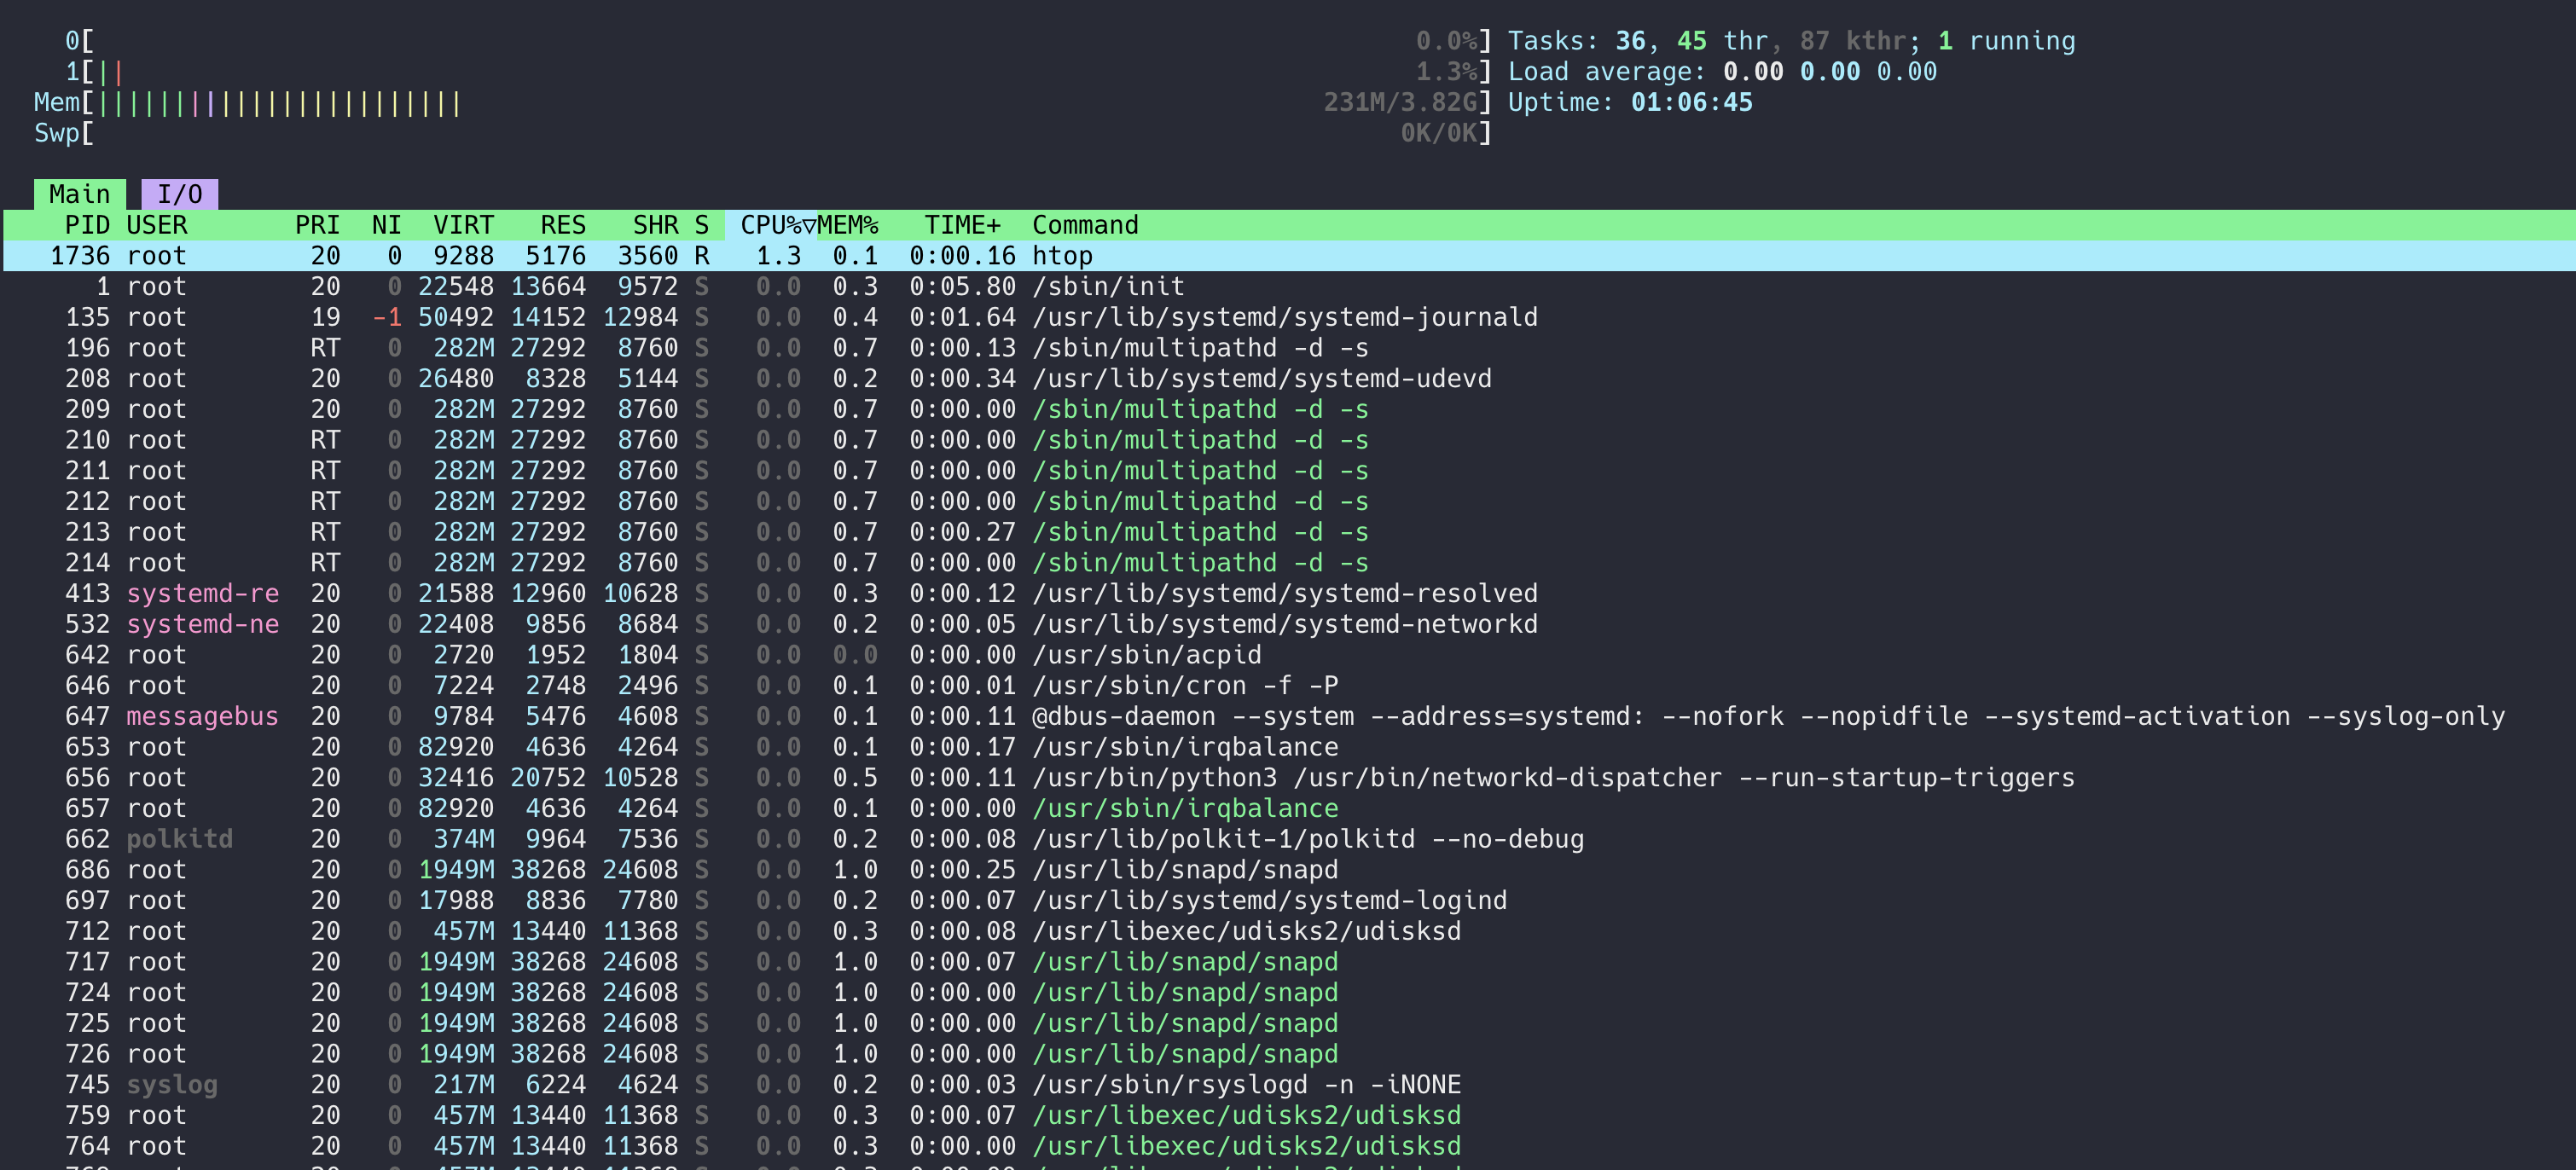
2. htop
What it is: An interactive, user-friendly process viewer. Supports mouse, scrolling, tree view, and per-CPU bars. No logging or historical graphs.
Installation
# Debian/Ubuntu
sudo apt install htop

# RHEL/CentOS/Fedora
sudo dnf install htop
sudo yum install htop

# macOS
brew install htop
Starting htop
htop                    # Default
htop -d 50              # Set delay to 50 centiseconds (0.5 s)
htop -u username        # Show only processes of "username"
htop -p 1234,5678       # Show only PIDs 1234, 5678
htop -t                 # Tree view by default
htop -s COLUMN          # Sort by COLUMN (e.g. PERCENT_CPU, PERCENT_MEM, TIME)
htop -C                 # No color (monochrome)
htop -h                 # Help
- Left: CPU bars (one per core), then Mem, Swp (swap).
- Right: Tasks, Load average, Uptime.
- F2 (Setup): Add/remove/reorder meters (e.g. CPU, Memory, Swap, Load, Uptime, etc.).
Interactive keys
Global
| Key |
Action |
| q |
Quit |
| F10 or q |
Quit |
| F1 or h |
Help |
| F2 |
Setup (meters, columns, colors, options) |
| Space |
Tag process (for batch actions) |
| U |
Untag all |
| F9 or k |
Kill: send signal to selected process (menu: SIGTERM, SIGKILL, etc.) |
| F7 |
Renice: decrease nice (higher priority) - root only for negative |
| F8 |
Renice: increase nice (lower priority) |
| F6 |
Sort by: choose column (arrow keys, Enter) |
| F3 or / |
Search: type string, Enter; F3 again for next |
| F4 or \ |
Filter: show only processes matching string |
| F5 |
Tree view: parent/child hierarchy |
| F6 |
Sort by column |
| I |
Invert sort order |
| p |
Show full command path |
| l |
List open files (lsof) for selected process - if supported |
| s |
Trace syscalls (strace) for selected process - if supported |
| t |
Toggle tree view on/off |
| H |
Toggle showing user threads (kernel threads on/off) |
| K |
Toggle kernel threads |
| P |
Sort by CPU% |
| M |
Sort by MEM% |
| T |
Sort by time |
| F4 |
Filter by string |
| ** |
Filter (same as F4) |
| , |
Increment delay (slower updates) |
| . |
Decrement delay (faster updates) |
Navigation
| Key |
Action |
| Up / Down or k / j |
Move selection |
| PgUp / PgDn |
Page up/down |
| Home |
First process |
| End |
Last process |
| Left / Right |
Scroll horizontally (when columns don’t fit) |
- Meters: Left/Right columns - add CPU, Memory, Swap, Load, etc.
- Display options: Tree view, show custom thread names, hide userland threads, highlight program name, etc.
- Columns: Add/remove/reorder process columns (PID, USER, PRIORITY, NICE, M_SIZE, etc.).
- Colors: Choose color theme.
- Custom (if available): Customize further.
Mouse
- Click on process: select.
- Scroll: scroll list.
- Click on column header: sort by that column.
- Click on meter area: cycle that meter’s display (e.g. text/bar).
Column meanings (examples)
| Column |
Meaning |
| PID |
Process ID |
| USER |
Owner |
| PRIORITY |
Kernel priority |
| NICE |
Nice value |
| M_SIZE |
Virtual memory |
| M_RESIDENT |
Resident memory |
| M_SHARE |
Shared memory |
| STATE |
R/S/D/Z/T |
| CPU% |
CPU usage |
| MEM% |
Memory % |
| TIME+ |
CPU time |
| Command |
Command line |
Tips for your blog
- Compare with top: mouse, tree view, multi-column sort, no need to remember single-letter keys.
- Show F2 to add Network or Disk meters (if compiled in).
- Use filter (F4) to show only “nginx” or “java” for demos.
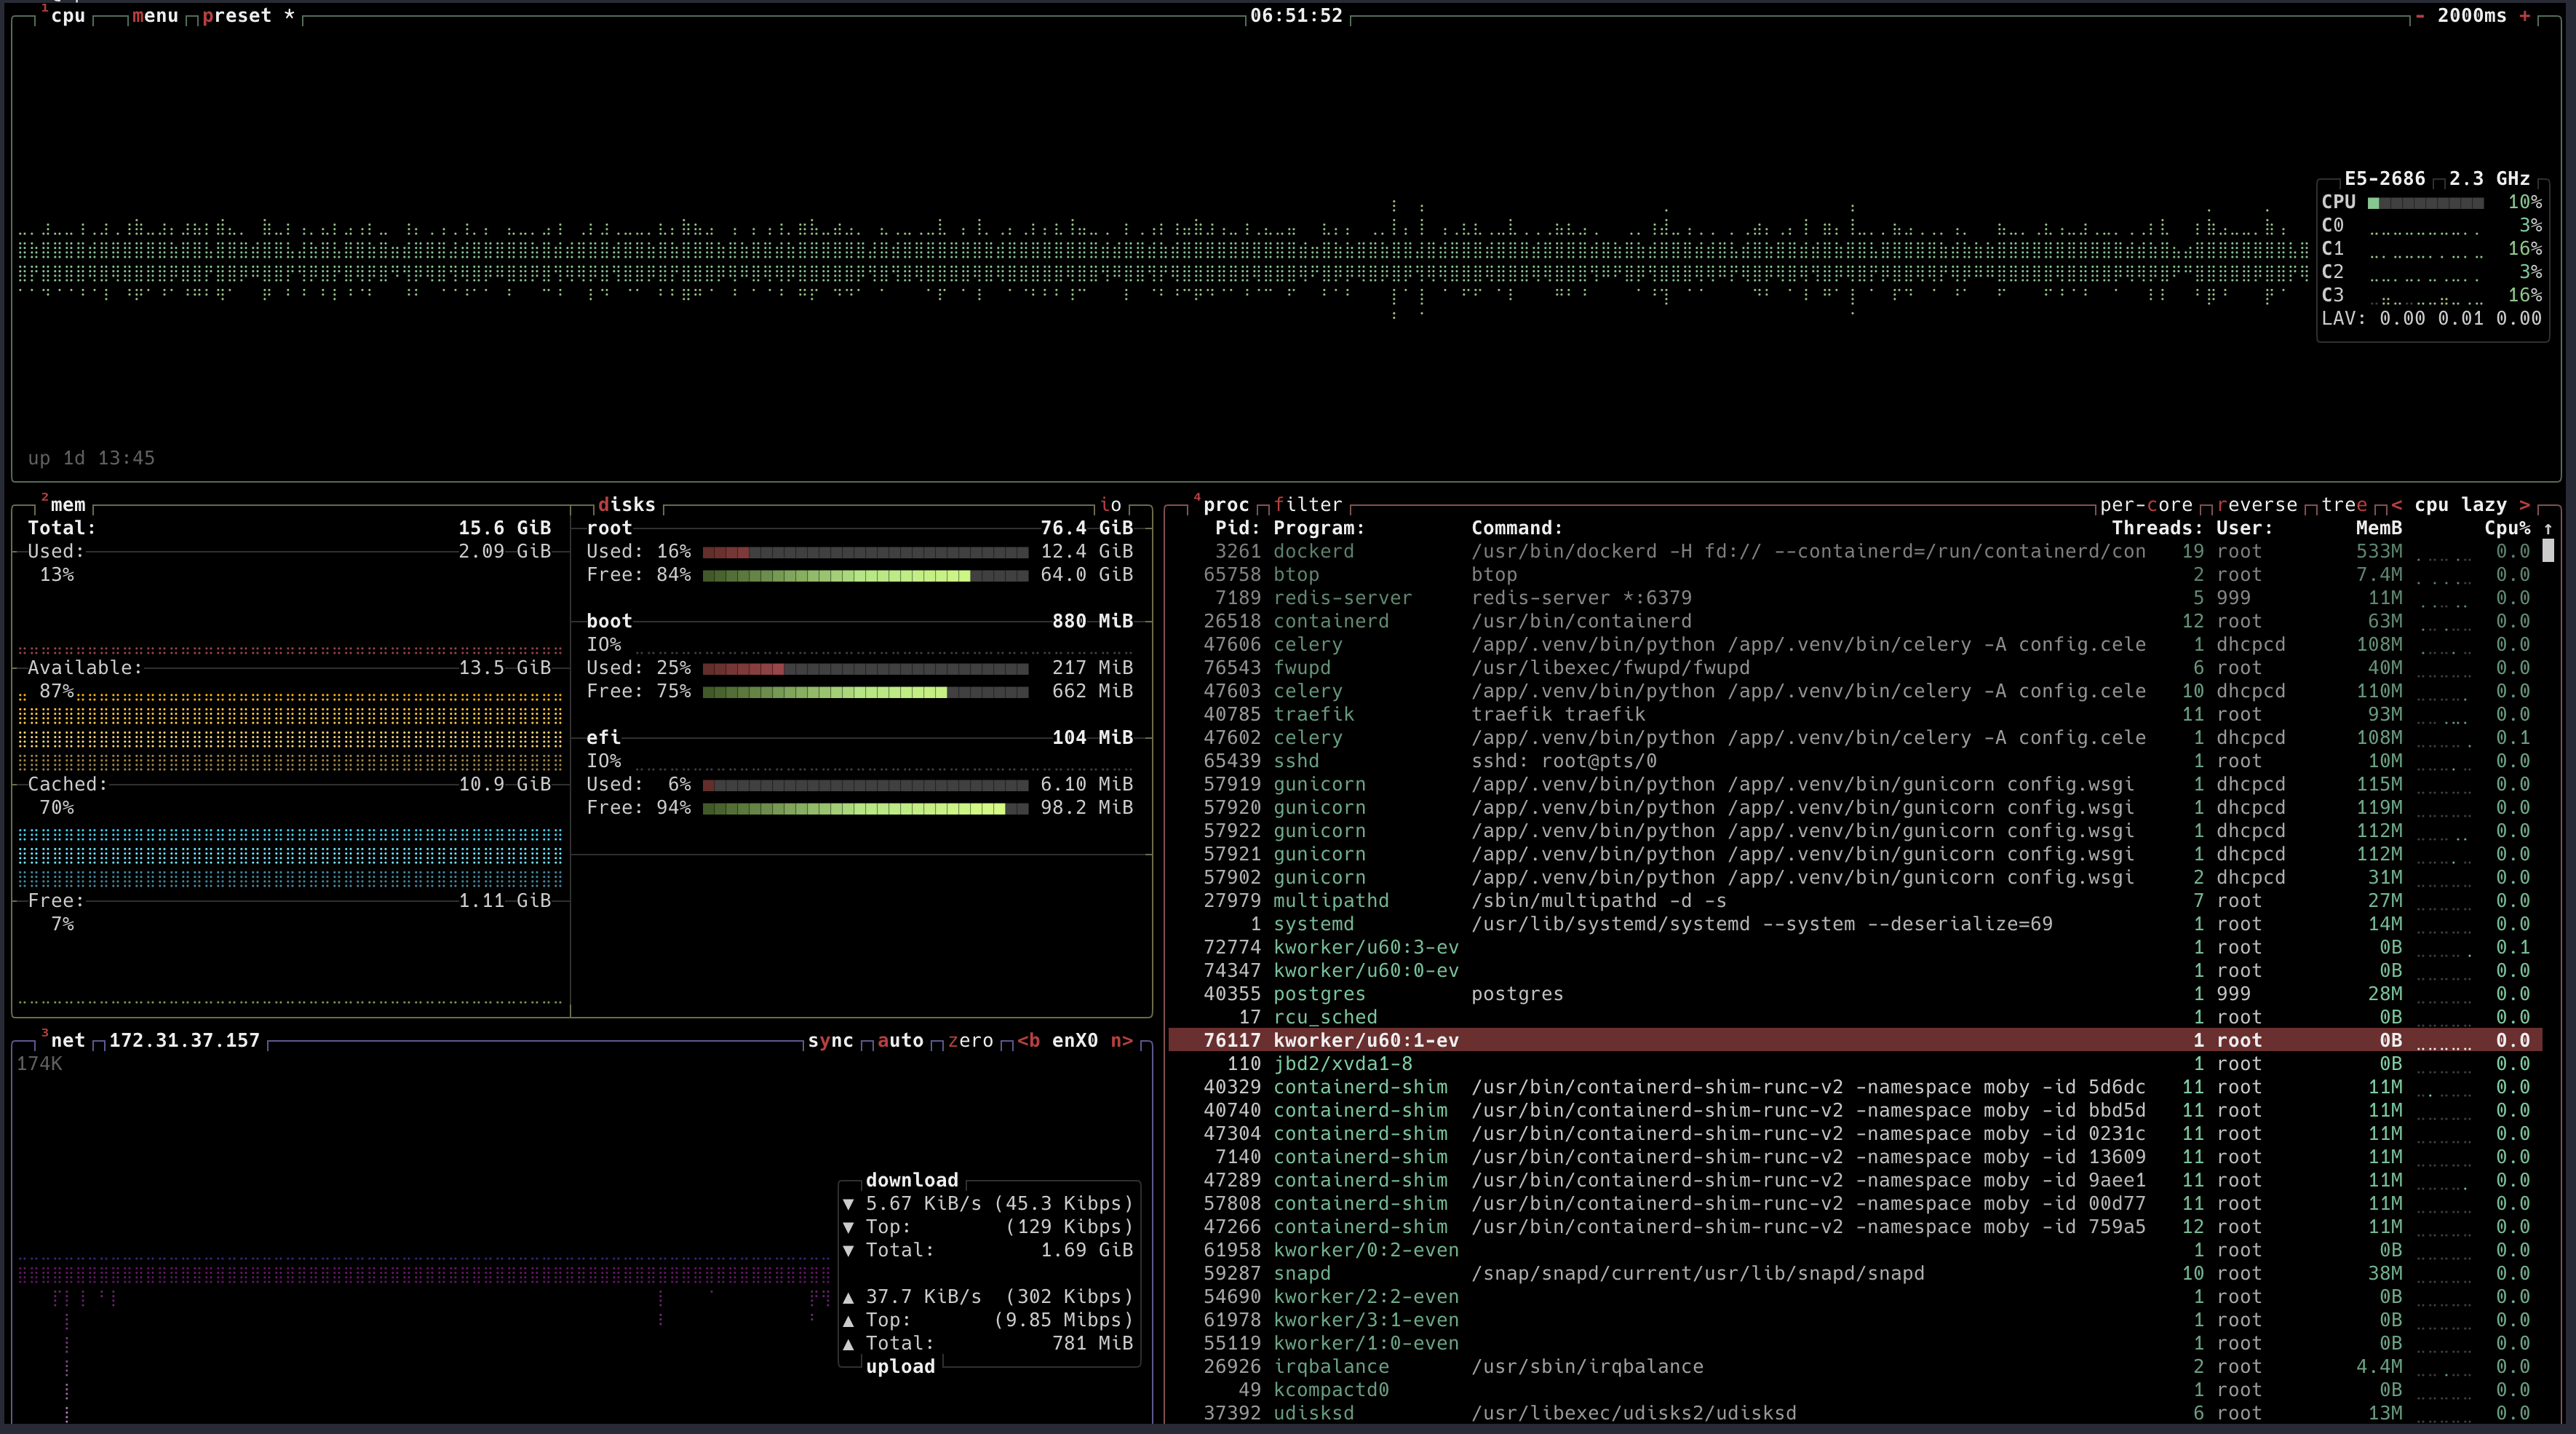
3. btop
What it is: A modern, GPU-accelerated resource monitor. Successor to bpytop. Rich UI with historical graphs, disk and network stats, and mouse support.
Installation
# Debian/Ubuntu (may need newer repo or build)
sudo apt install btop

# From source (recommended for latest)
# https://github.com/aristocratos/btop

# Fedora
sudo dnf install btop

# macOS
brew install btop
Starting btop
btop                    # Default
btop -t                 # Force TTY mode (no box-drawing)
btop -p PID             # Start with process box focused
btop -h                 # Help
Layout (default)
- Top: CPU (per-core + average), Memory, Disk (per device), Network (per interface).
- Bottom: Process list (table).
- Boxes can be resized (mouse or keys) and toggled on/off.
Main key bindings
Global
| Key |
Action |
| q |
Quit |
| h or ? |
Help |
| Esc |
Back / close menu or popup |
| Tab |
Next box (cycle focus) |
| Shift+Tab |
Previous box |
| 1-9 |
Focus box 1-9 directly |
When a graph/box is focused (CPU, Mem, etc.)
| Key |
Action |
| m |
Toggle minimal view (compact) |
| + / - |
Add/remove one line of height |
| Mouse drag |
Resize box (if enabled) |
Process box
| Key |
Action |
| Up/Down or k/j |
Move selection |
| PgUp/PgDn |
Page up/down |
| Home/End |
First/last process |
| Space |
Expand/collapse (tree) or tag |
| T |
Tree view (collapse/expand) |
| t |
Toggle tree view |
| b |
Toggle filter (show only matching) |
| f |
Set filter string |
| / |
Search |
| n |
Next search match |
| p |
Toggle program path (full path vs. name) |
| k |
Kill: choose signal (e.g. SIGTERM, SIGKILL) |
| r |
Renice (nice value) |
| e |
Show environment (popup) |
| s |
Show open files (lsof-style) - if available |
| M |
Sort by memory |
| P |
Sort by CPU |
| T |
Sort by time |
| I |
Invert sort |
| , / . |
Decrease/increase update speed |
| Key |
Action |
| O or o |
Options menu (theme, behavior, etc.) |
| u |
Cycle used memory display (programs/cache/both) - in options or on Mem box |
| Left/Right |
Scroll process list horizontally |
Mouse
- Click process: select.
- Scroll: scroll list.
- Click column header: sort by column.
- Resize: drag box borders (if enabled in options).
Box-specific
- CPU: Per-core bars + average; sometimes 1 toggles per-core.
- Mem: Bar + breakdown (used/cache/etc.). u in options to change what “used” means.
- Net: Per-interface RX/TX; n or click to cycle interface.
- Disk: Per-disk read/write; d or click to cycle disk.
- Process: f filter, / search, T tree, k kill, r renice.
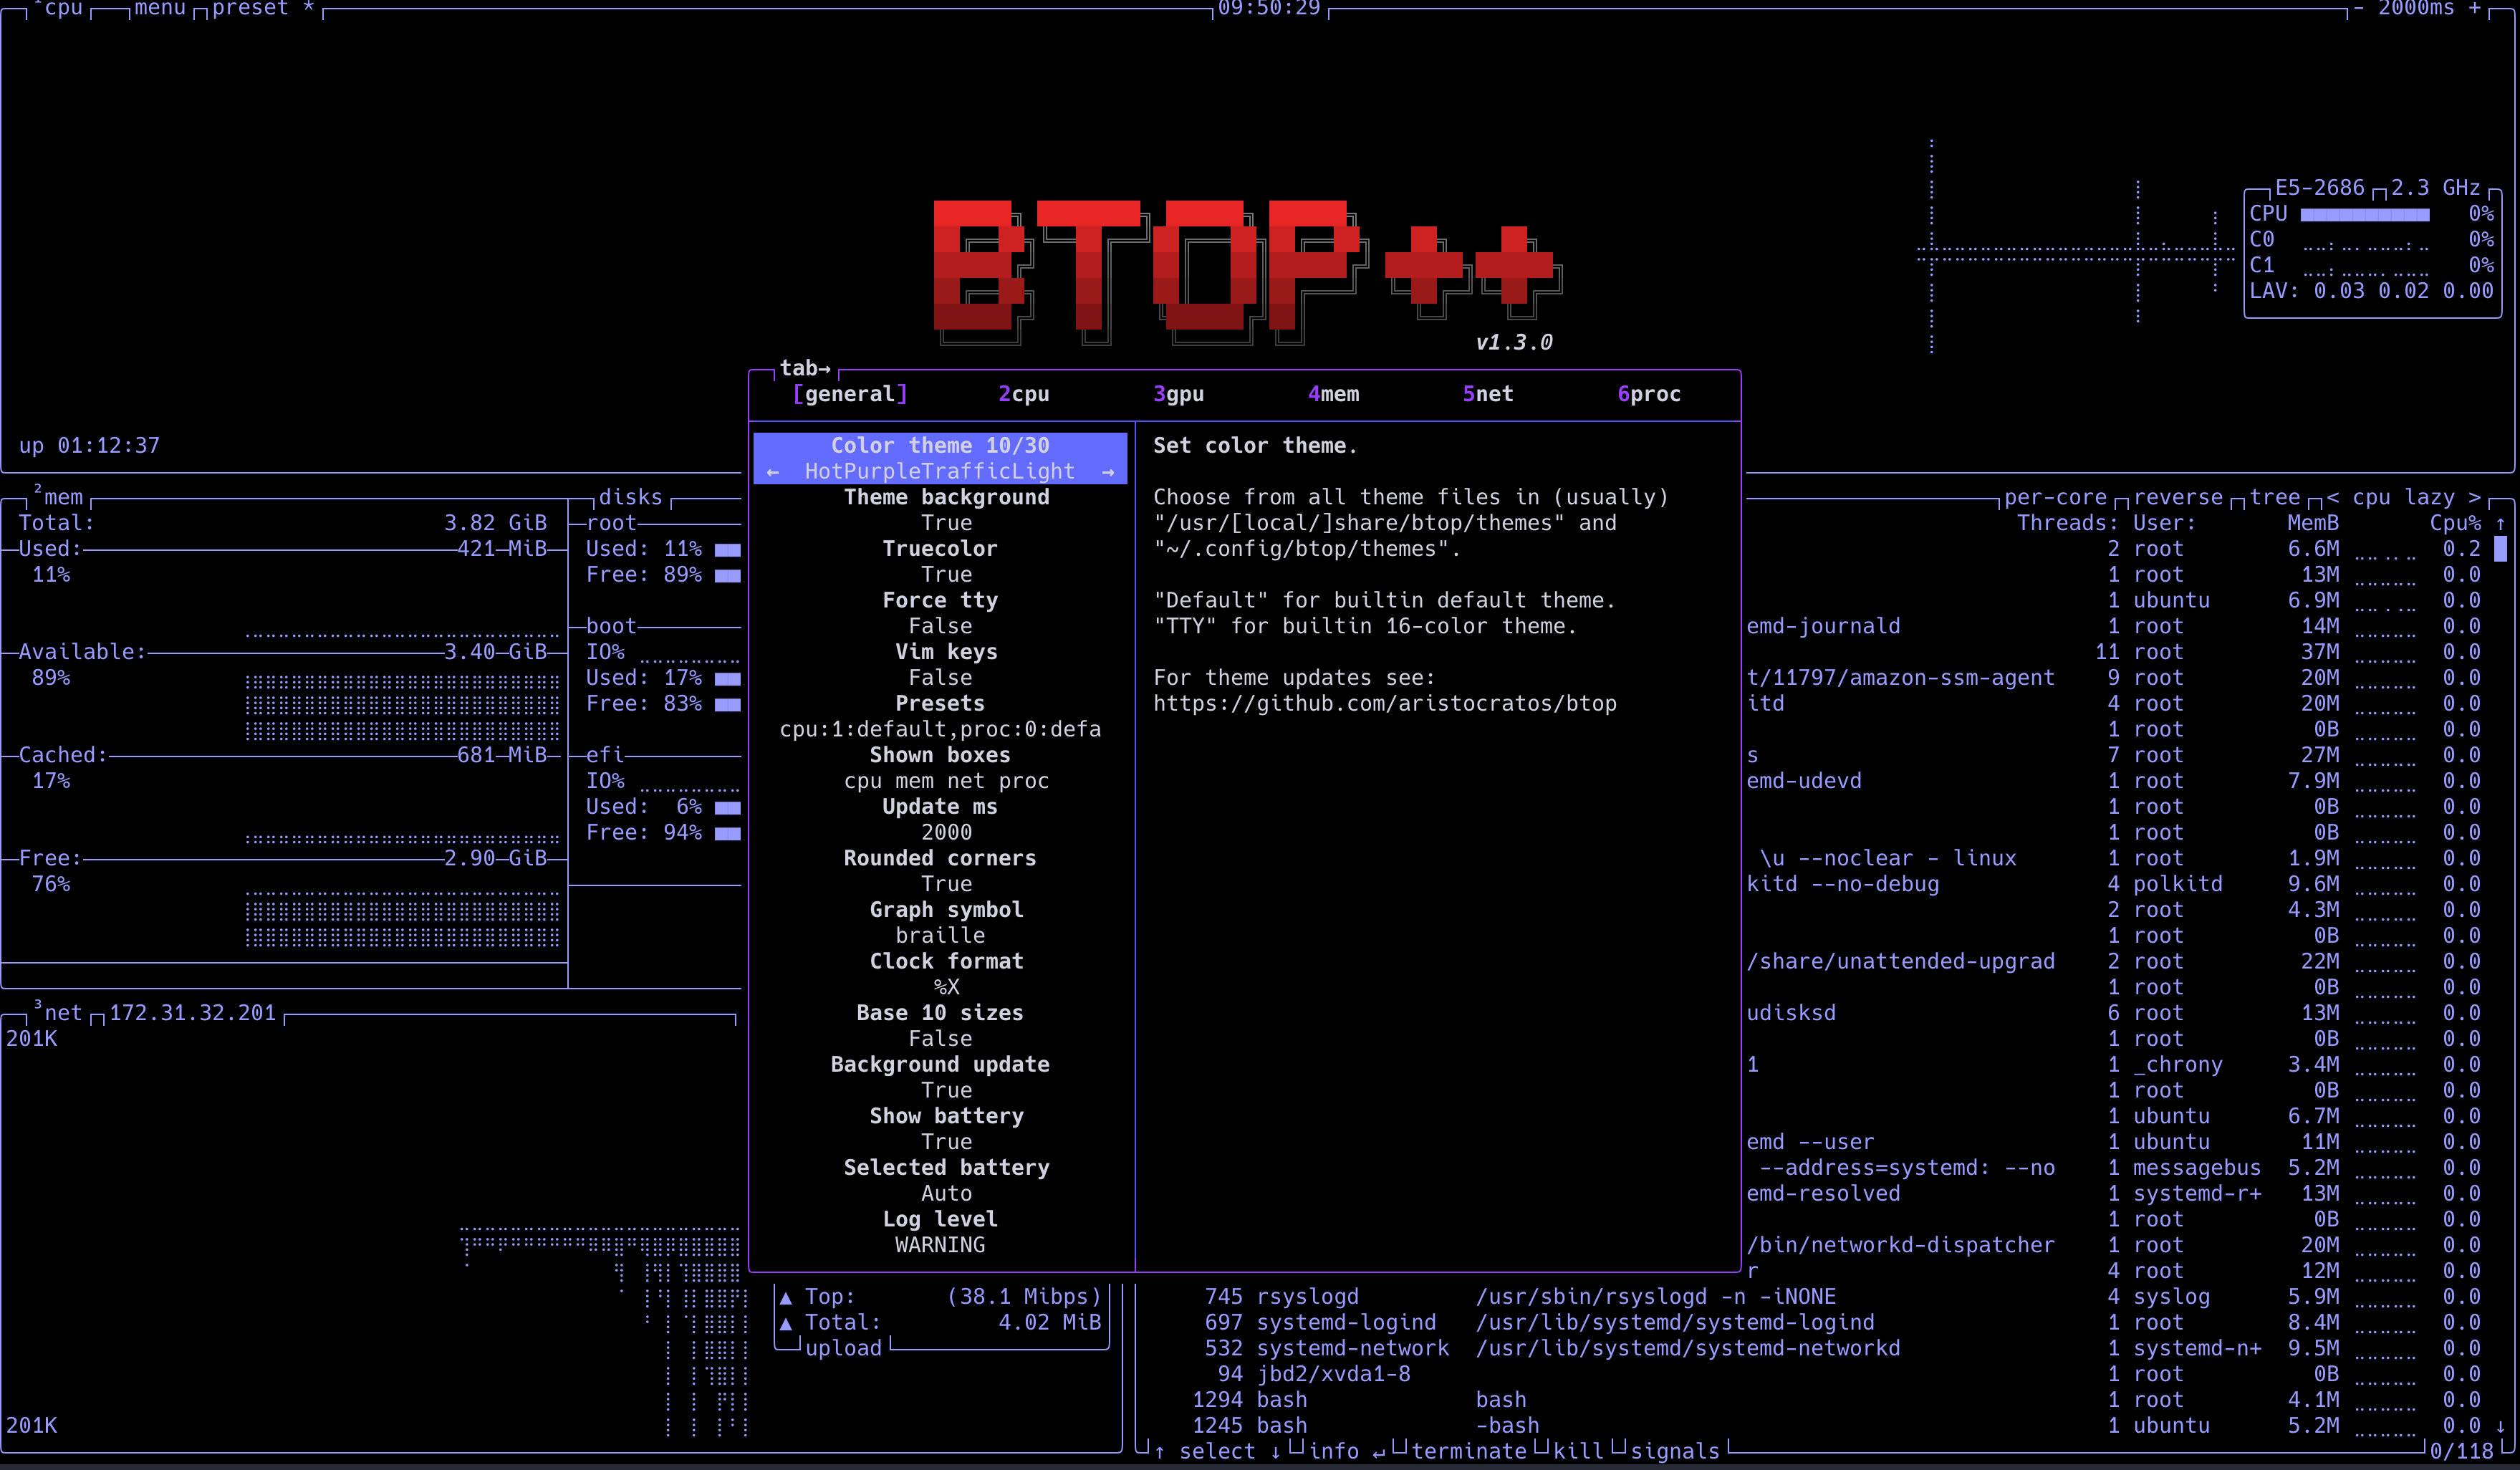
Themes and options
- O → Themes: select built-in themes (default, flat, etc.).
- O → Options: update interval, rounded corners, graph symbols, etc.
- O → Presets: save/load layout and options.
Tips for your blog
- Emphasize visuals: historical graphs, disk/network in one screen.
- Compare with htop: btop has graphs and disk/network; htop is lighter.
- Show tree view and filter for “nginx” or “python” for a clear demo.
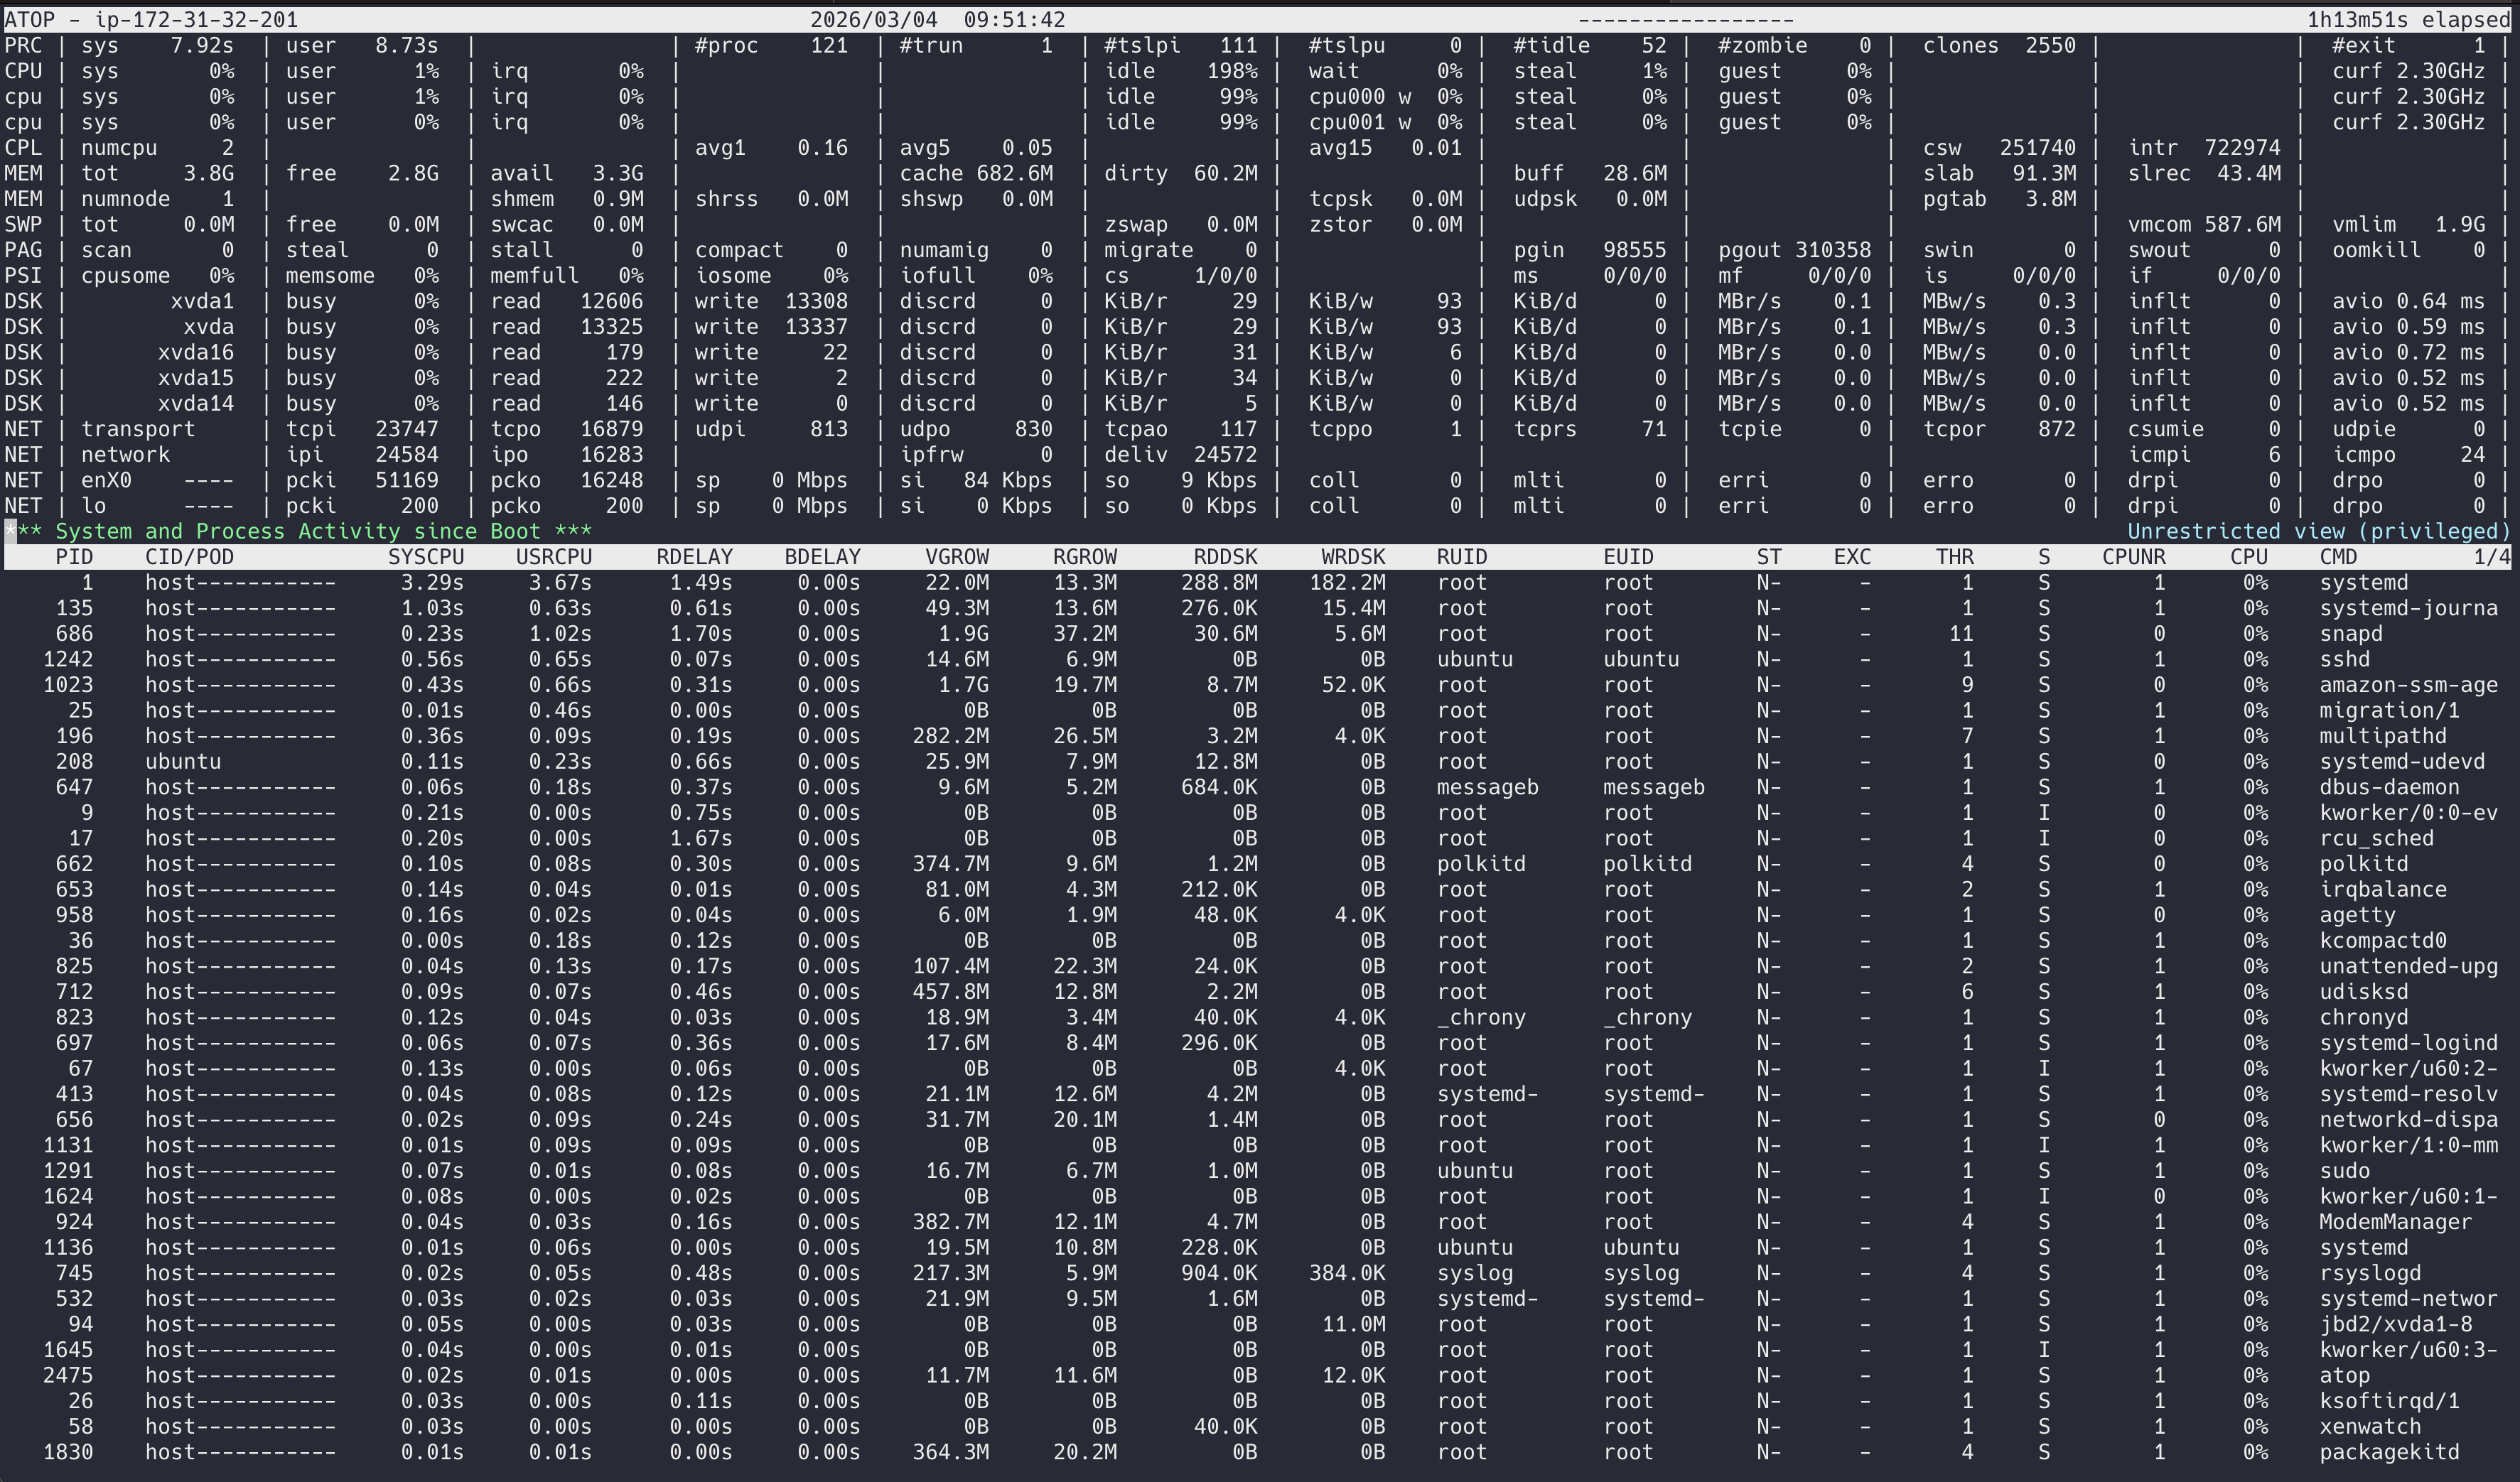
4. atop
What it is: Advanced system and process monitor with logging. Records counters to disk so you can replay past intervals. Focus on system resources (CPU, disk, network, memory) and which processes used them.
Installation
# Debian/Ubuntu
sudo apt install atop

# RHEL/CentOS/Fedora
sudo dnf install atop
sudo yum install atop
Logging (critical concept)
- atop runs as a daemon (atop -w /var/log/atop/atop_YYYYMMDD) or via systemd timer.
- Logs are binary; view with:
atop -r /var/log/atop/atop_YYYYMMDD.
- In replay, t = next sample, T = previous, b = begin, e = end.
Starting atop (live)
atop                    # Live, default interval 10 s
atop 5                  # Live, 5 s interval
atop -w /path/to/file   # Record to file (binary)
atop -r /path/to/file   # Replay from file
atop -r /path/to/file -b HH:MM -e HH:MM   # Replay time range
atop -r file -b 202403041200 -e 202403041300  # Replay by timestamp
- CPU: sys/user/nice/idle/wait/irq/steal, and per-CPU if toggled.
- MEM: total/free/cache/buffer.
- SWP: swap total/free.
- DSK: per disk: busy%, read rate, write rate (e.g. sda).
- NET: per interface: recv/send (e.g. eth0).
Process list shows which processes used CPU, disk, or network in that interval (often sorted by “most active”).
Interactive commands (live and replay)
Navigation (replay)
| Key |
Action |
| t |
Next sample (forward in time) |
| T |
Previous sample |
| b |
Jump to begin of log |
| e |
Jump to end of log |
| g |
Go to timestamp (prompt) |
Display toggles
| Key |
Action |
| c |
Toggle full command line |
| C |
Toggle per-CPU (CPU line) |
| d |
Toggle disk stats (show/hide DSK line) |
| m |
Toggle memory stats |
| n |
Toggle network stats |
| l |
Toggle load average |
| a |
Toggle all expansion (per CPU, per disk, etc.) |
| 1 |
Toggle single line per process (compact) |
Process selection / sorting
| Key |
Action |
| p |
Show only processes (default view) |
| s |
Show only scheduled (blocked) processes |
| y |
Show only active (non-sleeping) processes |
| z |
Show only zombie processes |
| f |
Filter: prompt for filter (e.g. user, command) |
| / |
Search in process list |
| P |
Sort by CPU (default in many setups) |
| M |
Sort by memory |
| D |
Sort by disk |
| N |
Sort by network |
| A |
Sort by most active (composite) |
| n |
Next (in search) |
Process actions
| Key |
Action |
| k |
Kill: prompt PID, then signal |
| r |
Renice |
Other
| Key |
Action |
| h or ? |
Help |
| q |
Quit |
| W |
Write current process list to file (for reporting) |
| v |
Toggle “show deleted processes” (in replay) |
| V |
Toggle “show exited processes” (in replay) |
Process columns (examples)
| Column |
Meaning |
| PID |
Process ID |
| SYSCPU |
CPU in system mode (this interval) |
| USRCPU |
CPU in user mode (this interval) |
| VGROW |
Virtual memory growth |
| RGROW |
Resident memory growth |
| RDDSK |
Sectors read (disk) |
| WRDSK |
Sectors written |
| RNET |
Bytes received |
| SNET |
Bytes sent |
| ST |
State (R/S/D/Z/T, etc.) |
Log rotation and daemon
- Default log dir:
/var/log/atop/.
- atop -w /var/log/atop/atop_YYYYMMDD runs one day per file.
- Often installed as atop.service (interval e.g. 600 s) and atop-rotate to keep N days.
# Example: record 10-second interval to file
sudo atop -w /tmp/atop_log 5

# Replay
atop -r /tmp/atop_log
# Then use t / T to move in time
Tips for your blog
- Focus on “why atop”: historical and resource attribution (who used disk/network).
- Demo: start atop -w /tmp/demo, run a heavy dd or curl, stop atop, then atop -r /tmp/demo and step with t to show disk/CPU at that time.
- Compare: top/htop = “now”; atop = “then” and “who”.
Quick Reference Tables
When to use which
| Goal |
Tool |
| “What’s using CPU right now?” on any server |
top or htop |
| “Pretty dashboard + disk/network” |
btop |
| “What was using disk/CPU yesterday at 3pm?” |
atop (with logging) |
| “Minimal deps, scripts, SSH” |
top |
| “Interactive, tree view, mouse” |
htop |
| “Capacity planning, audits” |
atop |
One-line “install + run” (for your tests)
# top (usually already there)
top -d 2

# htop
sudo apt install -y htop && htop

# btop
sudo apt install -y btop && btop

# atop (with 10s logging for 1 min, then replay)
sudo apt install -y atop && sudo atop -w /tmp/atop_test 10
# (wait 1 min, Ctrl+C)
atop -r /tmp/atop_test
Blog testing checklist
- top: Run
top, show 1 (per-CPU), t/m (bars), P/M (sort), k (kill), u (user filter). Capture with top -b -n 1.
- htop: Run
htop, show tree (F5), filter (F4), kill (F9), setup (F2) meters/columns.
- btop: Run
btop, show CPU/Mem/Disk/Net boxes, process tree, filter, options (O).
- atop: Start
atop -w /tmp/atop_demo 5, generate load (e.g. stress -c 2 or dd), stop, replay with atop -r /tmp/atop_demo, use t/T, show disk (D) and network (N) sort.
Use this guide as your single source of commands and concepts for testing and writing your blog.
Testing scenarios for your server (blog-ready)
Run these on one server and capture output/screenshots for your post.
# Terminal 1: generate some load
stress-ng --cpu 2 --timeout 60s   # or: yes > /dev/null & (then kill later)

# Terminal 2: run each tool for a few seconds and exit
top -d 1 -b -n 1 > /tmp/top_snapshot.txt
htop -t -d 10 -n 1 2>/dev/null || true   # htop has no true batch; run interactively and screenshot
btop -t -p 1 2>/dev/null || true         # same; screenshot
atop 2 -b -n 1 2>/dev/null || true      # if supported
Use top -b -n 1 and atop for scriptable snapshots; use htop and btop interactively and take screenshots for the blog.
Scenario 2: atop “before/after” load
# Start logging (as root or with sudo)
sudo atop -w /tmp/atop_blog 5

# In another terminal: create load
dd if=/dev/zero of=/tmp/blog_test bs=1M count=500
stress-ng --cpu 2 --timeout 30s

# Stop atop (Ctrl+C in the atop terminal), then replay
atop -r /tmp/atop_blog
# Press 't' to step through samples; 'D' to sort by disk; 'P' by CPU
Screenshot the replay at a moment when disk and CPU are busy - good for explaining “who used disk/CPU.”
Scenario 3: Process tree and filtering
- htop: Start, press F5 (tree), F4 and type
nginx (or any process name), screenshot.
- btop: Start, press t for tree, f and type filter, screenshot.
- top: Run top, press V (tree view), u and enter a username, screenshot.
Scenario 4: Key bindings quick reference (for a table in your blog)
| Tool |
Quit |
Sort CPU |
Sort Mem |
Kill |
Filter/User |
Tree |
| top |
q |
P |
M |
k |
u |
V |
| htop |
q/F10 |
P / F6 |
M / F6 |
F9/k |
F4 / \ |
F5 |
| btop |
q |
P |
M |
k |
f / b |
t/T |
| atop |
q |
P |
M |
k |
f |
- |
Summary
- top: Universal, scriptable, no mouse; learn P, M, k, u, V, 1, t, m.
- htop: Interactive, tree, filter, mouse; F2 setup, F4 filter, F5 tree, F9 kill.
- btop: Graphs, disk/network, pretty; O options, f filter, t tree, resize boxes.
- atop: Logging and replay; atop -w to record, atop -r to replay; t/ T step time; D/ N for disk/network.

Comments (0)
No comments yet. Be the first to share your thoughts.
Leave a comment