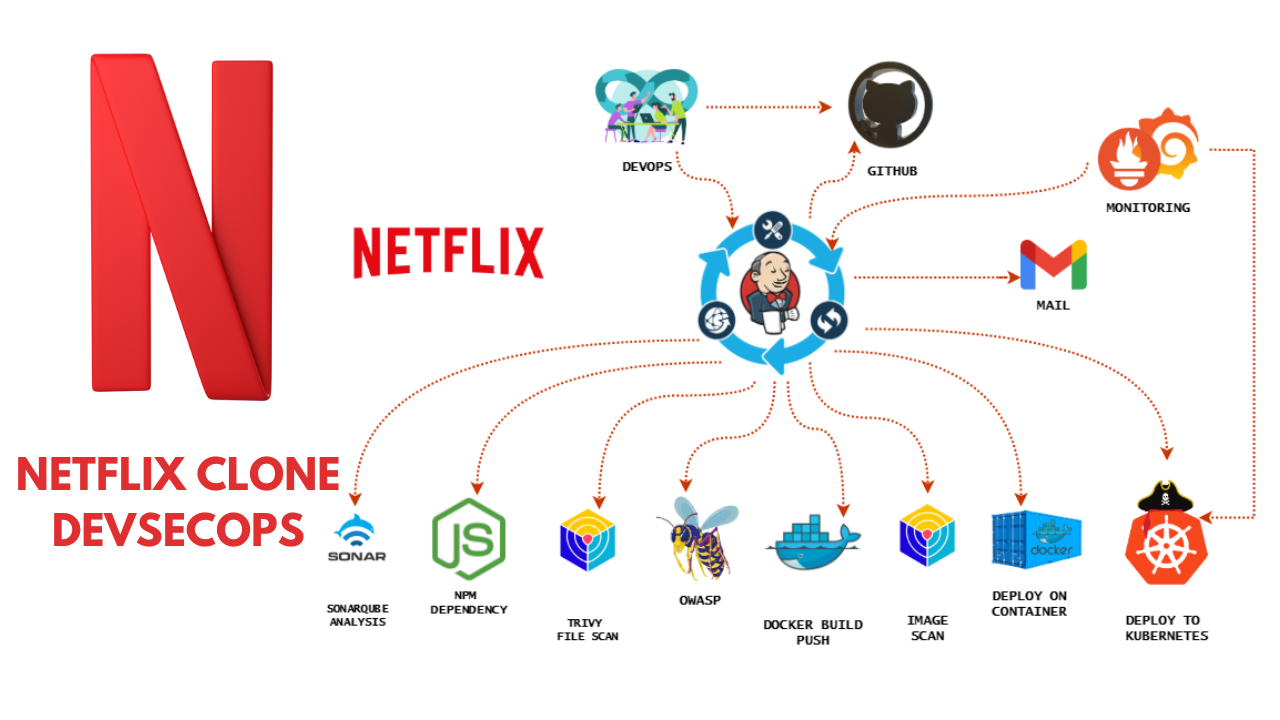
Hello friends, we will be deploying a Netflix clone. We will be using Jenkins as a CICD tool and deploying our application on a Docker container and Kubernetes Cluster and we will monitor the Jenkins and Kubernetes metrics using Grafana, Prometheus and Node exporter. I Hope this detailed blog is useful.
CLICK HERE FOR GITHUB REPOSITORY
Steps:-
Step 1 - Launch an Ubuntu(22.04) T2 Large Instance
Step 2 - Install Jenkins, Docker and Trivy. Create a Sonarqube Container using Docker.
Step 3 - Create a TMDB API Key.
Step 4 - Install Prometheus and Grafana On the new Server.
Step 5 - Install the Prometheus Plugin and Integrate it with the Prometheus server.
Step 6 - Email Integration With Jenkins and Plugin setup.
Step 7 - Install Plugins like JDK, Sonarqube Scanner, Nodejs, and OWASP Dependency Check.
Step 8 - Create a Pipeline Project in Jenkins using a Declarative Pipeline
Step 9 - Install OWASP Dependency Check Plugins
Step 10 - Docker Image Build and Push
Step 11 - Deploy the image using Docker
Step 12 - Kubernetes master and slave setup on Ubuntu (20.04)
Step 13 - Access the Netflix app on the Browser.
Step 14 - Terminate the AWS EC2 Instances.
Now, let’s get started and dig deeper into each of these steps:-
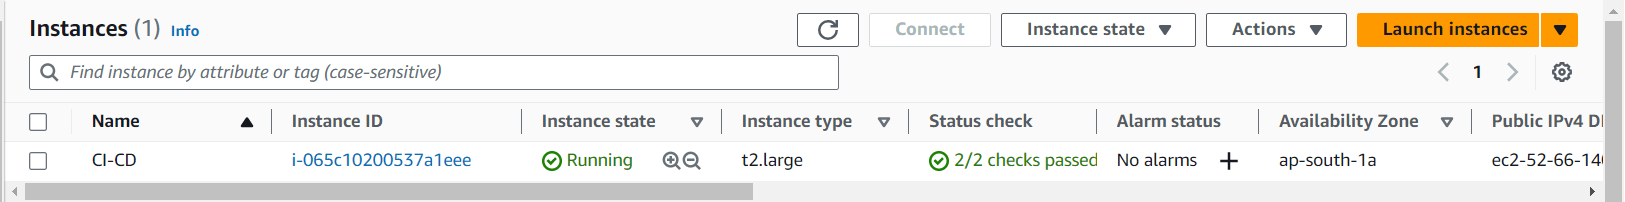
STEP1:Launch an Ubuntu(22.04) T2 Large Instance
Launch an AWS T2 Large Instance. Use the image as Ubuntu. You can create a new key pair or use an existing one. Enable HTTP and HTTPS settings in the Security Group and open all ports (not best case to open all ports but just for learning purposes it’s okay).
Step 2 - Install Jenkins, Docker and Trivy
2A - To Install Jenkins
Connect to your console, and enter these commands to Install Jenkins
vi jenkins.sh #make sure run in Root (or) add at userdata while ec2 launch
#!/bin/bash
sudo apt update -y
#sudo apt upgrade -y
wget -O - https://packages.adoptium.net/artifactory/api/gpg/key/public | tee /etc/apt/keyrings/adoptium.asc
echo "deb [signed-by=/etc/apt/keyrings/adoptium.asc] https://packages.adoptium.net/artifactory/deb $(awk -F= '/^VERSION_CODENAME/{print$2}' /etc/os-release) main" | tee /etc/apt/sources.list.d/adoptium.list
sudo apt update -y
sudo apt install temurin-17-jdk -y
/usr/bin/java --version
curl -fsSL https://pkg.jenkins.io/debian-stable/jenkins.io-2023.key | sudo tee \
                  /usr/share/keyrings/jenkins-keyring.asc > /dev/null
echo deb [signed-by=/usr/share/keyrings/jenkins-keyring.asc] \
                  https://pkg.jenkins.io/debian-stable binary/ | sudo tee \
                              /etc/apt/sources.list.d/jenkins.list > /dev/null
sudo apt-get update -y
sudo apt-get install jenkins -y
sudo systemctl start jenkins
sudo systemctl status jenkins
sudo chmod 777 jenkins.sh
./jenkins.sh    # this will installl jenkins
Once Jenkins is installed, you will need to go to your AWS EC2 Security Group and open Inbound Port 8080, since Jenkins works on Port 8080.
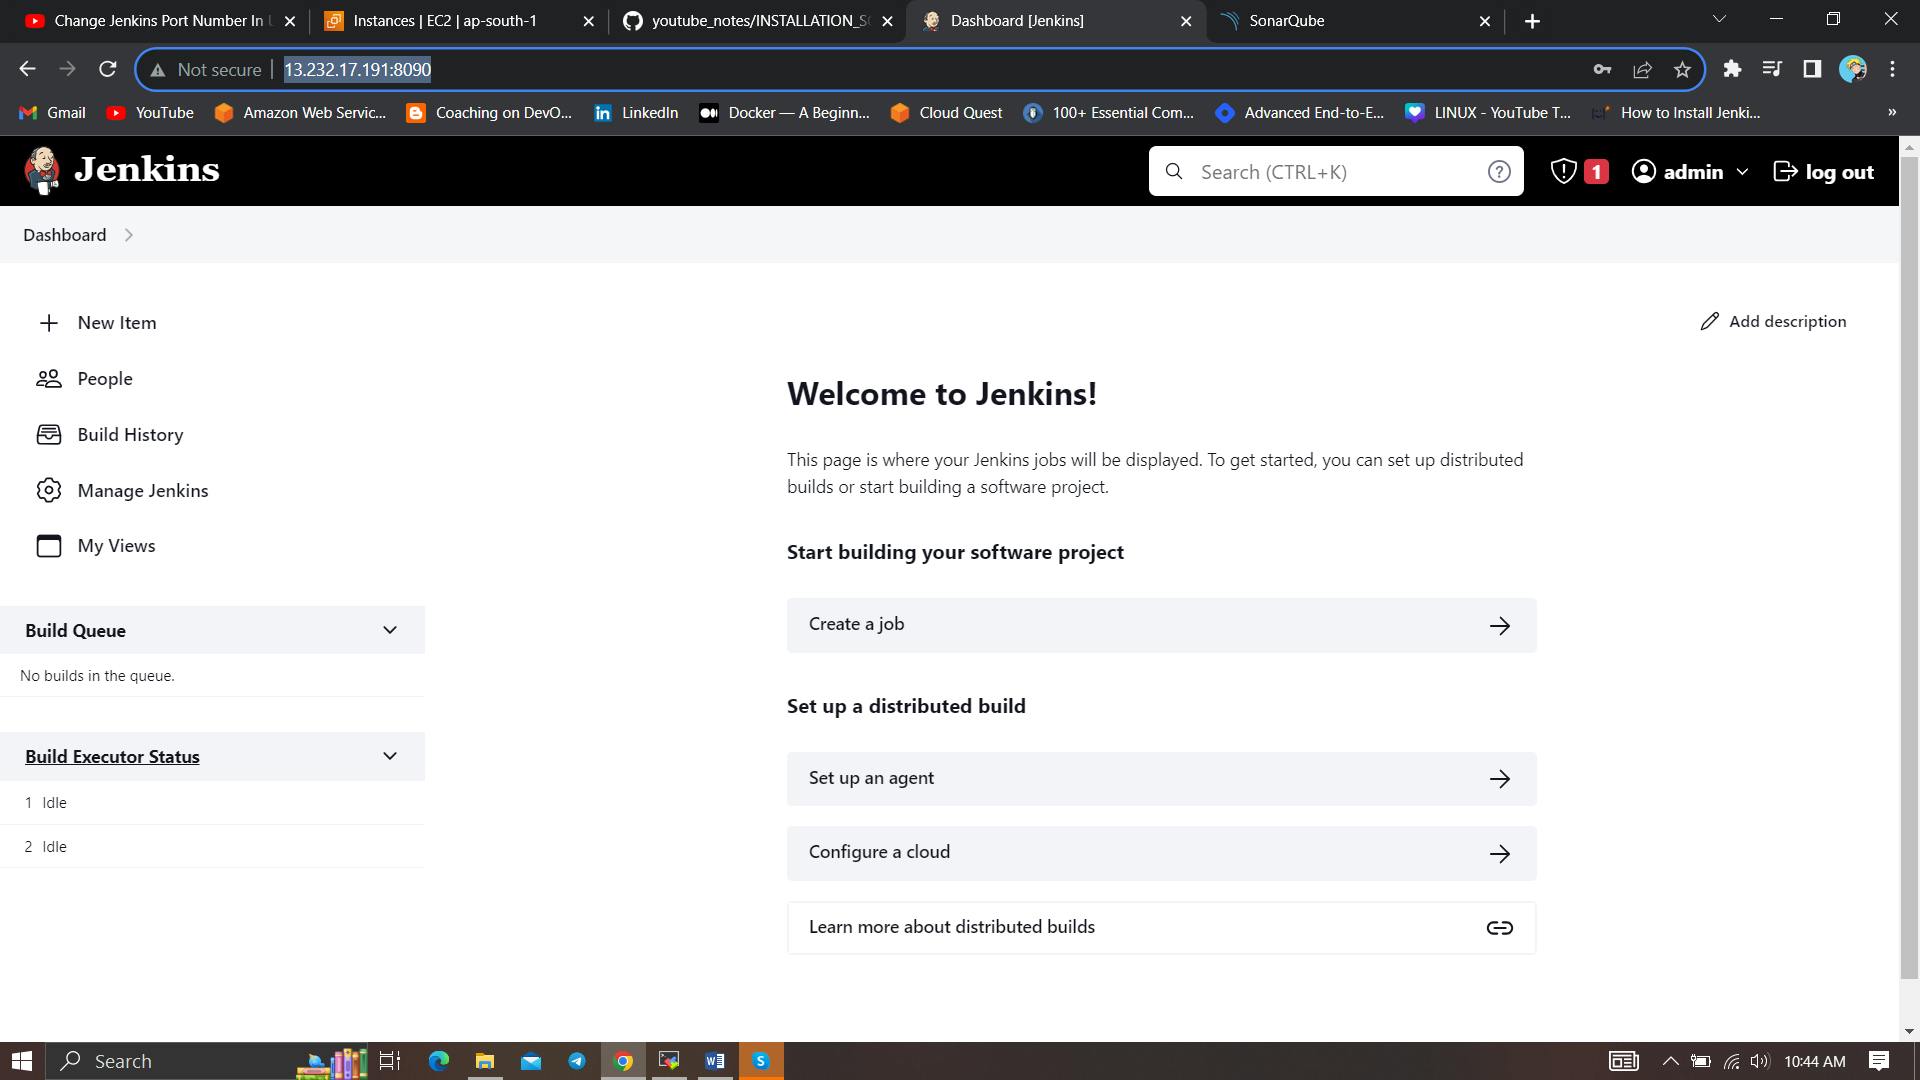
Now, grab your Public IP Address
sudo cat /var/lib/jenkins/secrets/initialAdminPassword
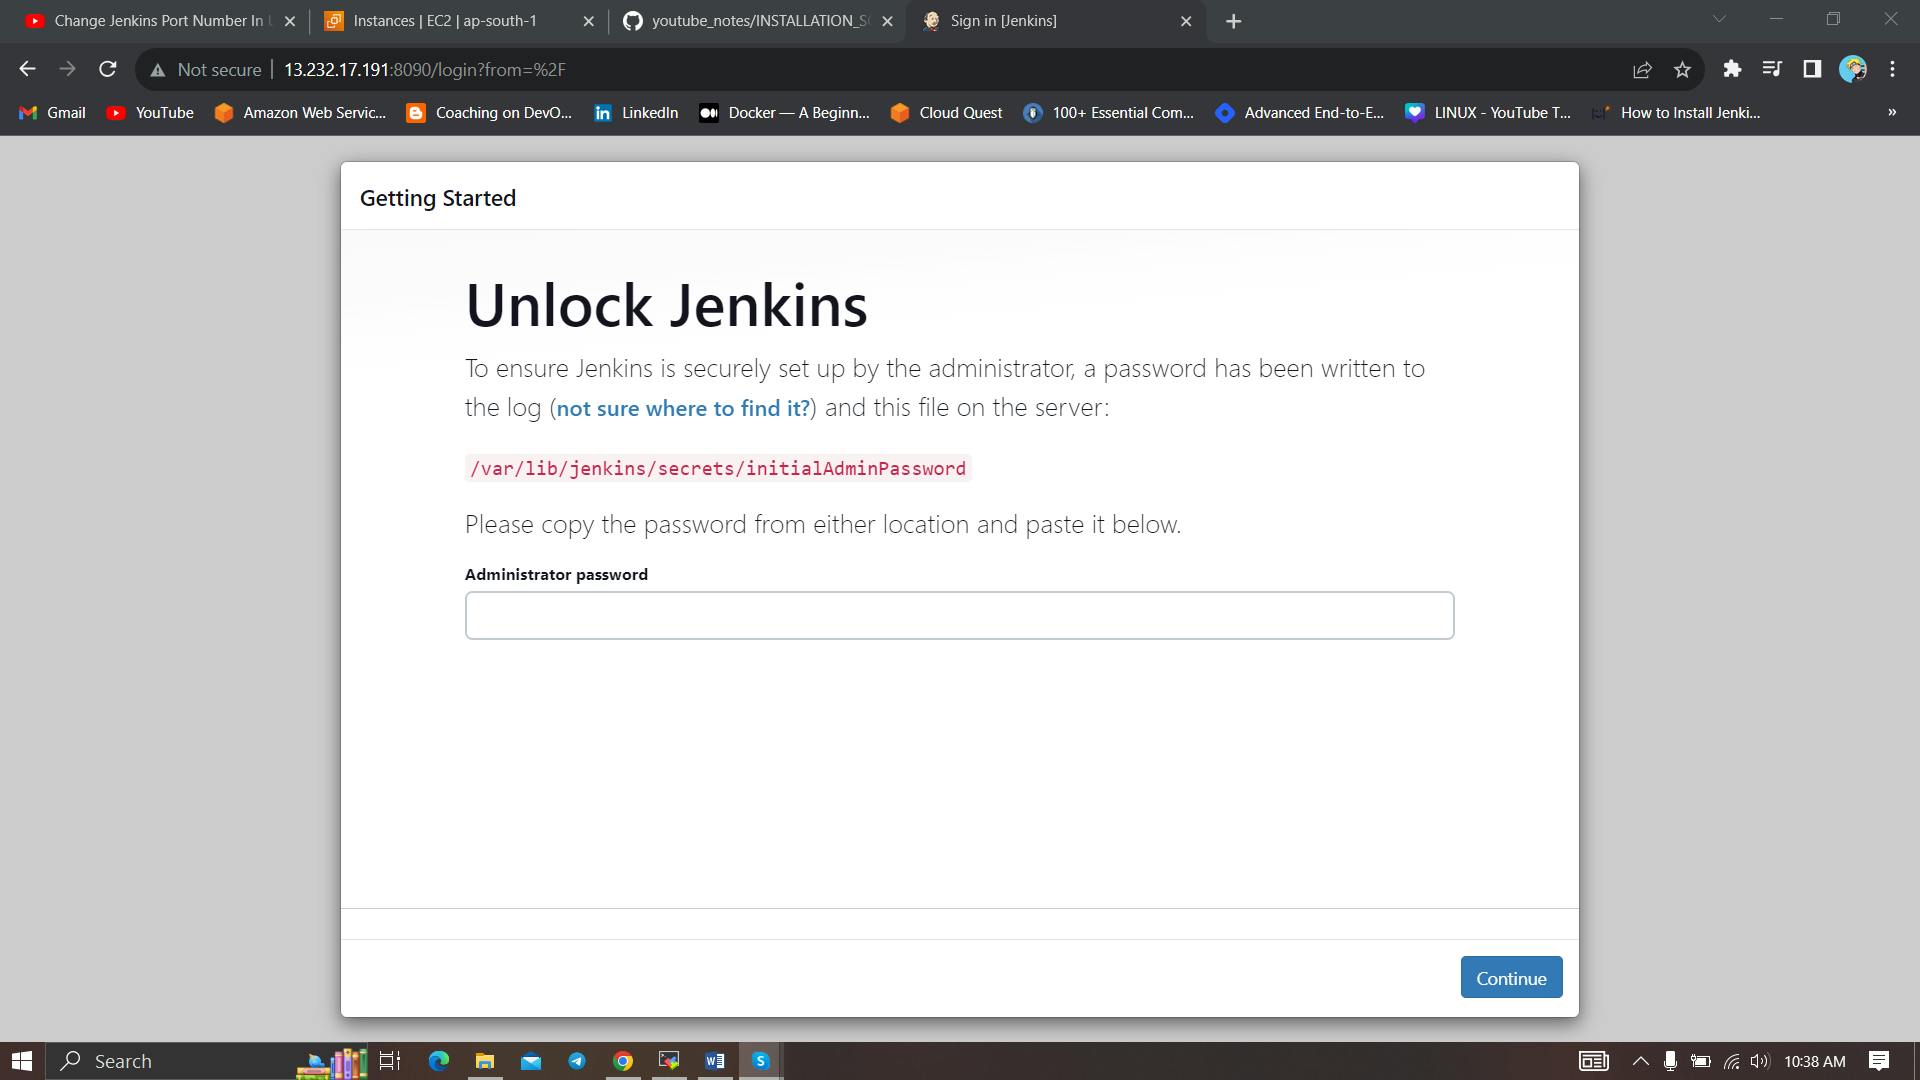
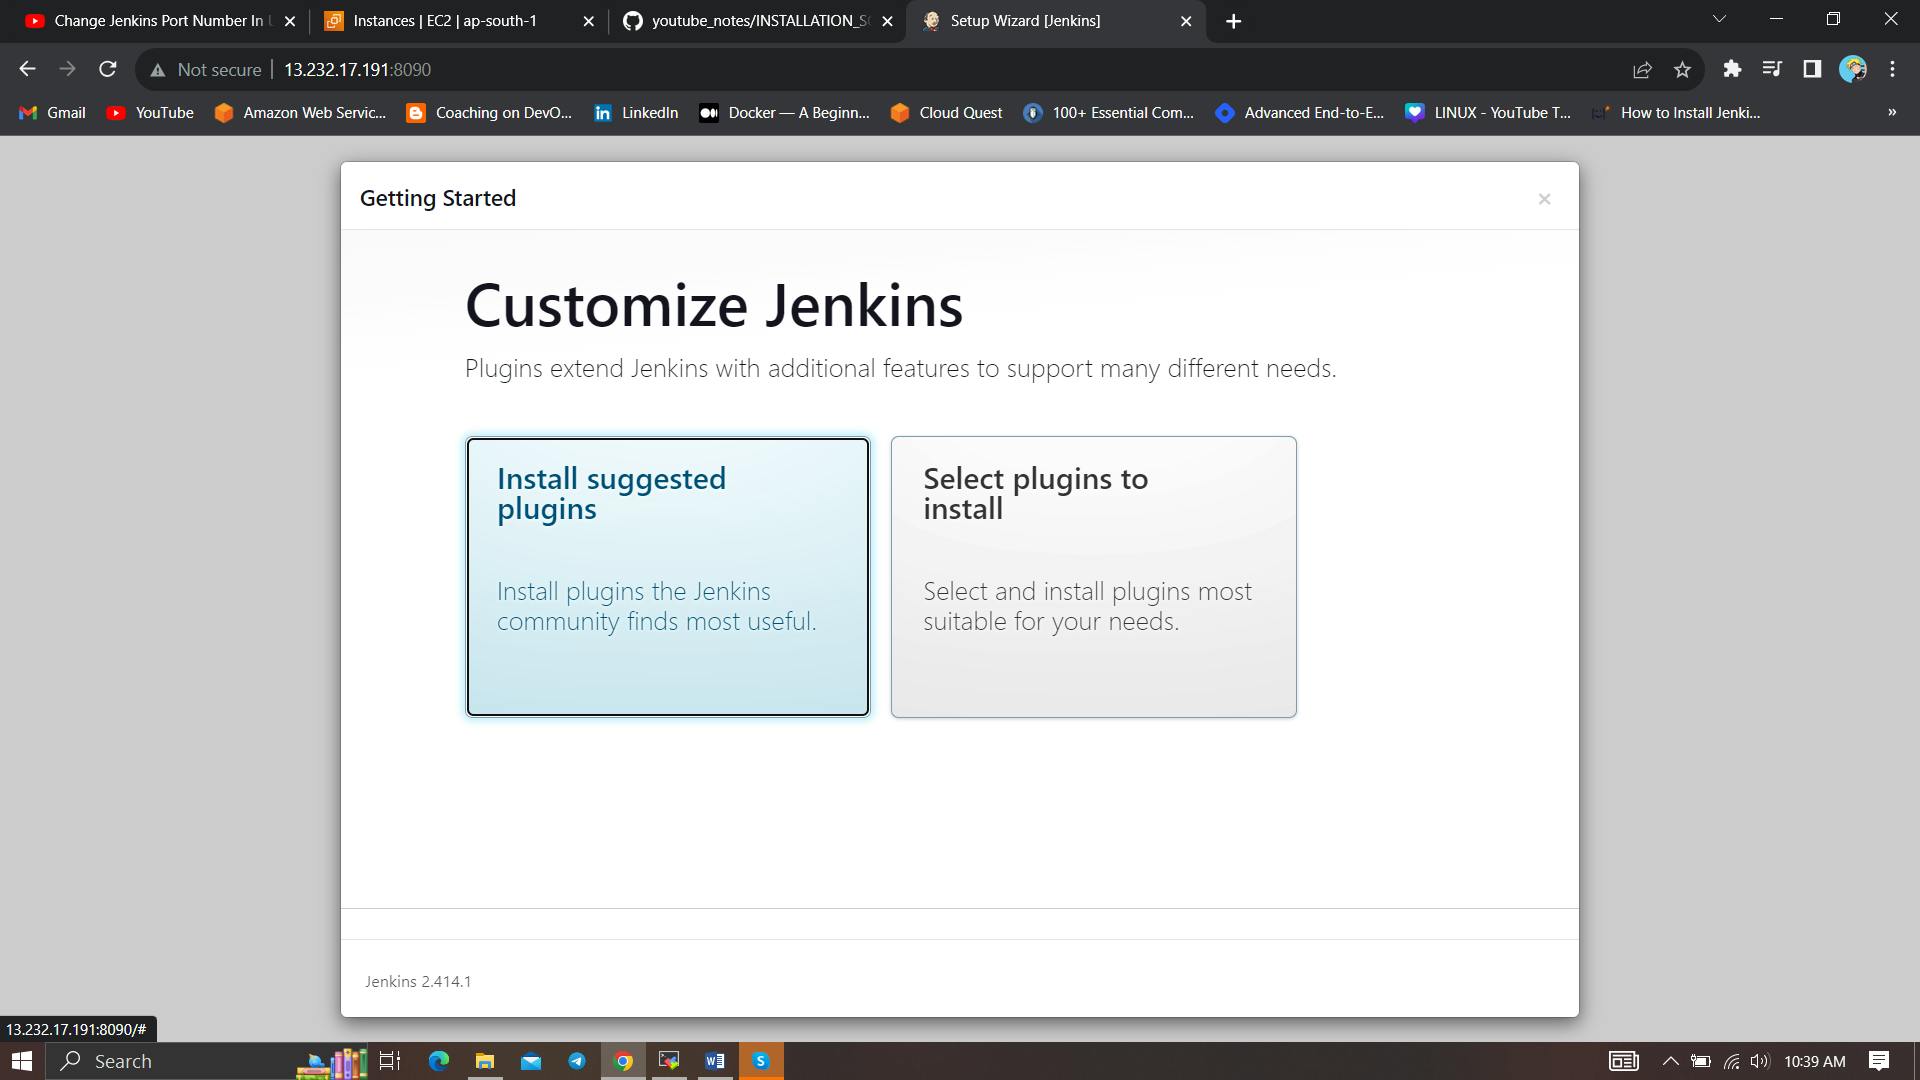
Unlock Jenkins using an administrative password and install the suggested plugins.
Jenkins will now get installed and install all the libraries.
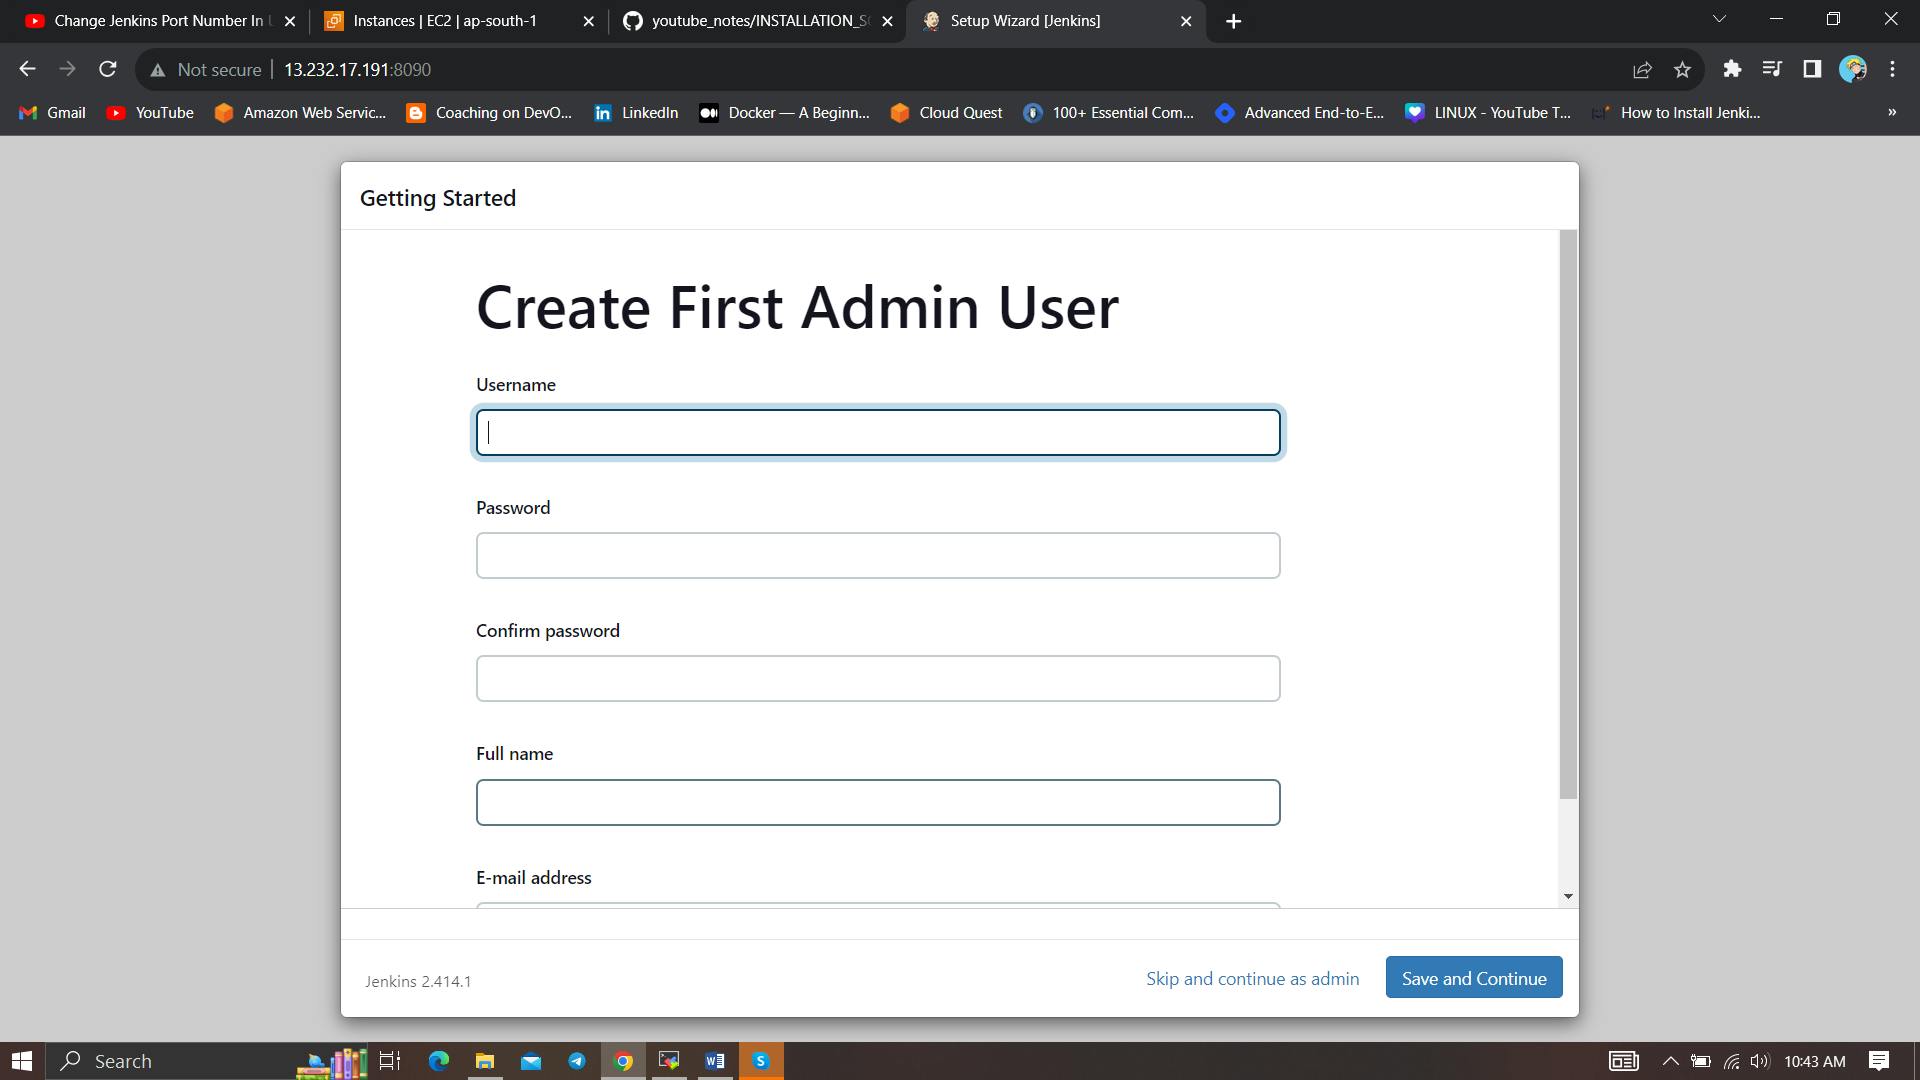
Create a user click on save and continue.
Jenkins Getting Started Screen.
2B - Install Docker
sudo apt-get update
sudo apt-get install docker.io -y
sudo usermod -aG docker $USER   #my case is ubuntu
newgrp docker
sudo chmod 777 /var/run/docker.sock
After the docker installation, we create a sonarqube container (Remember to add 9000 ports in the security group).
docker run -d --name sonar -p 9000:9000 sonarqube:lts-community
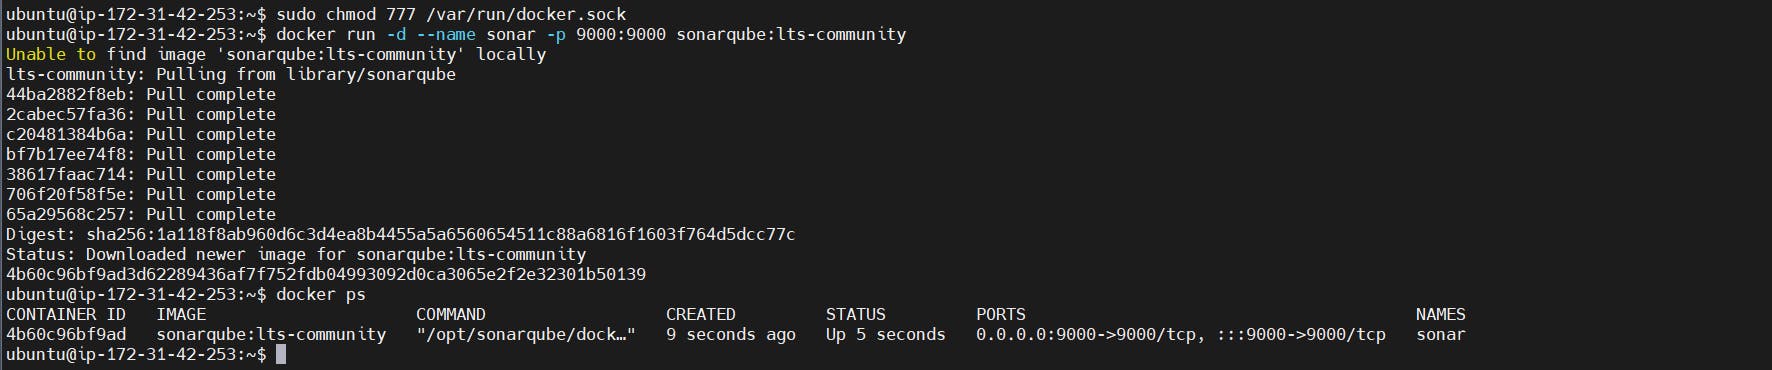
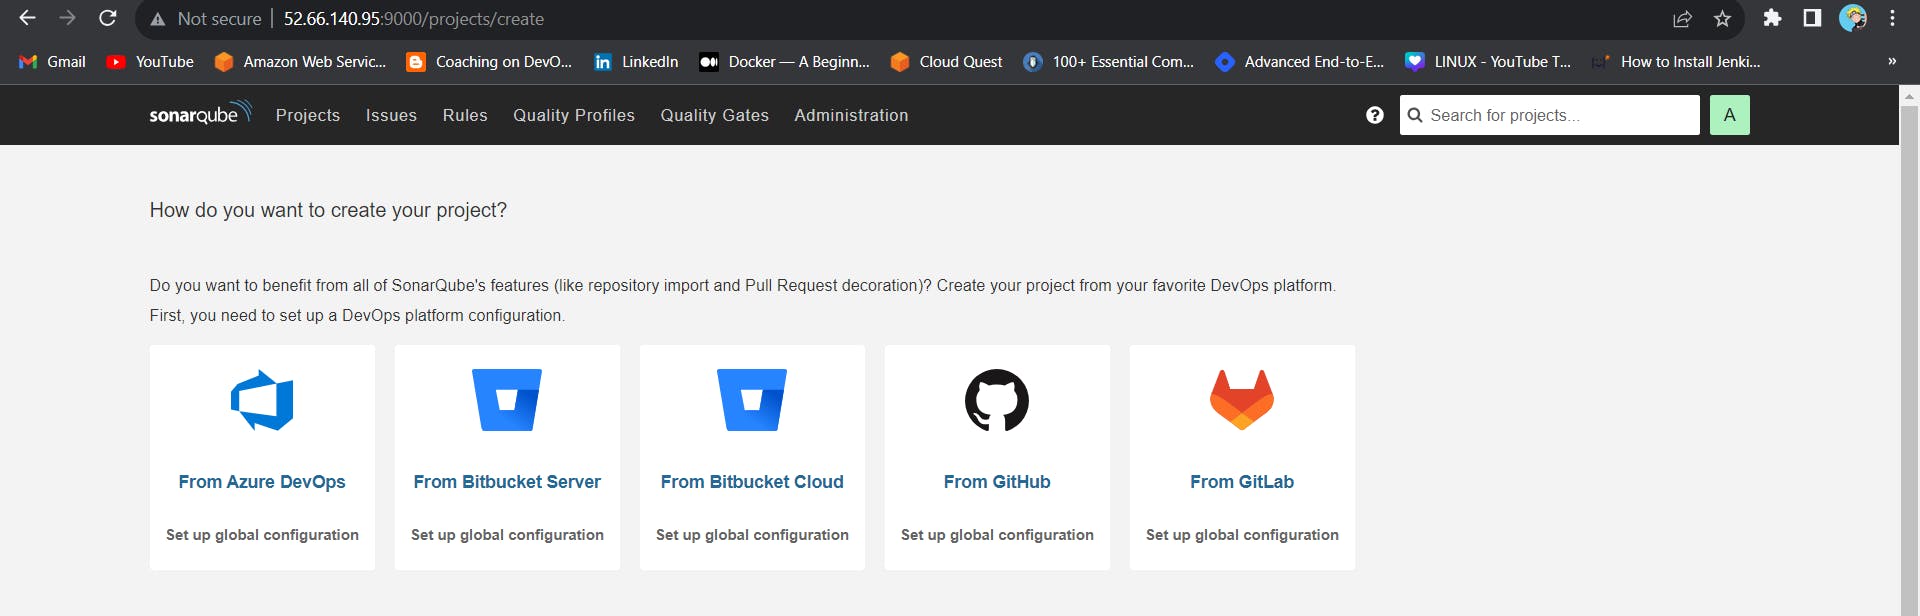
Now our sonarqube is up and running
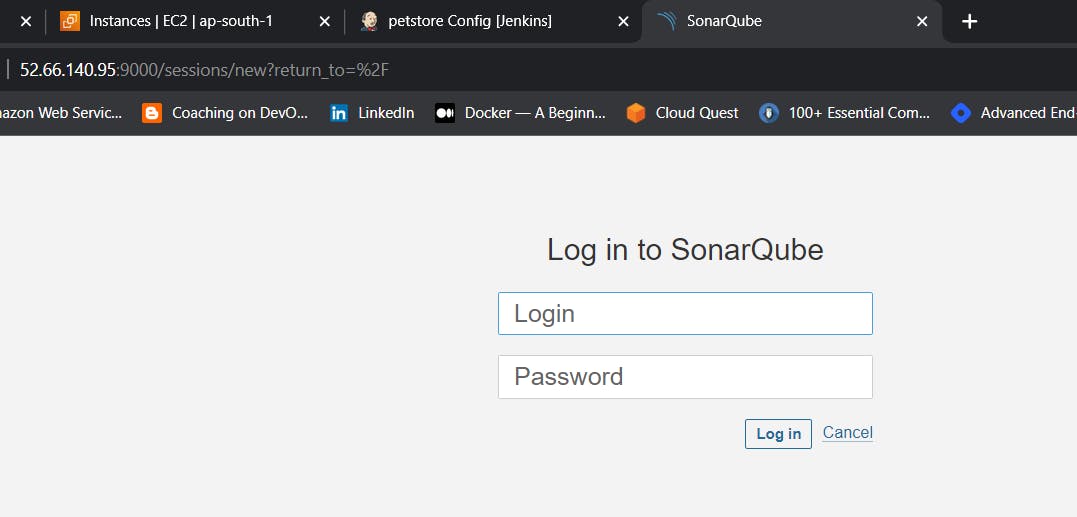
Enter username and password, click on login and change password
username admin
password admin
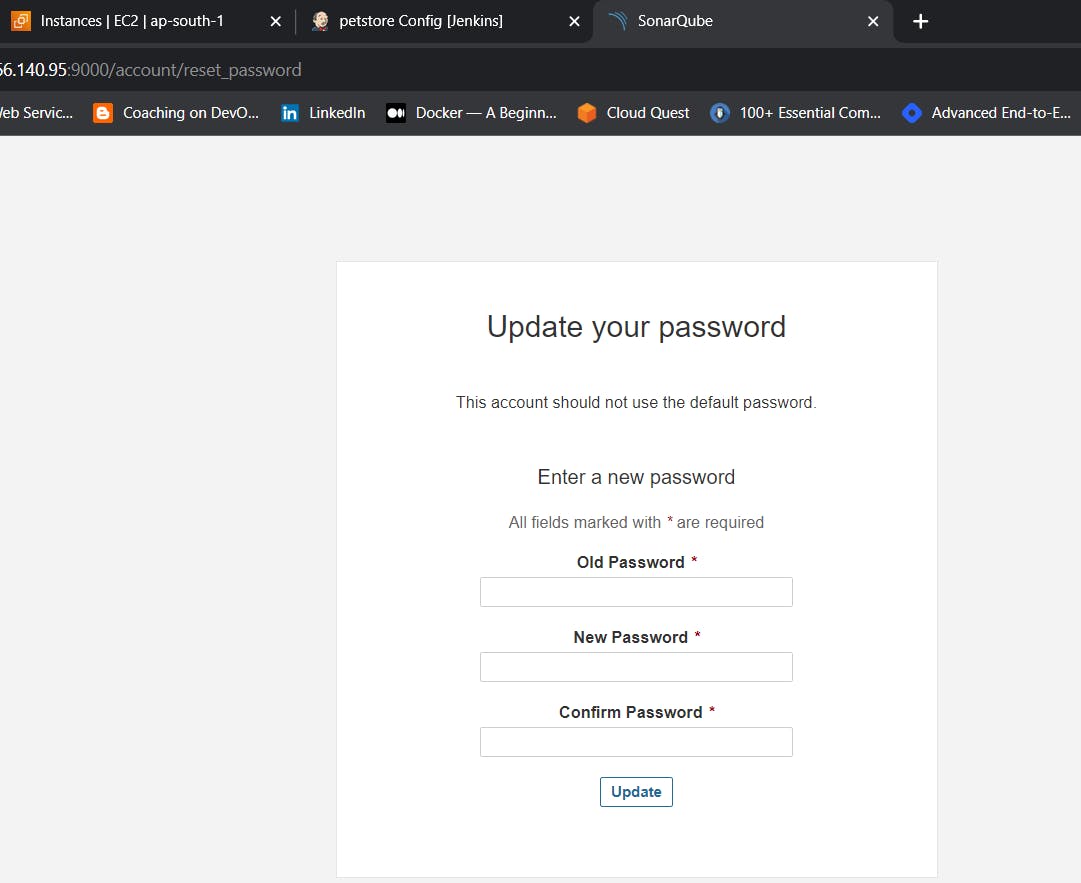
Update New password, This is Sonar Dashboard.
2C - Install Trivy
vi trivy.sh
sudo apt-get install wget apt-transport-https gnupg lsb-release -y
wget -qO - https://aquasecurity.github.io/trivy-repo/deb/public.key | gpg --dearmor | sudo tee /usr/share/keyrings/trivy.gpg > /dev/null
echo "deb [signed-by=/usr/share/keyrings/trivy.gpg] https://aquasecurity.github.io/trivy-repo/deb $(lsb_release -sc) main" | sudo tee -a /etc/apt/sources.list.d/trivy.list
sudo apt-get update
sudo apt-get install trivy -y
Step 3: Create a TMDB API Key
Next, we will create a TMDB API key
Open a new tab in the Browser and search for TMDB
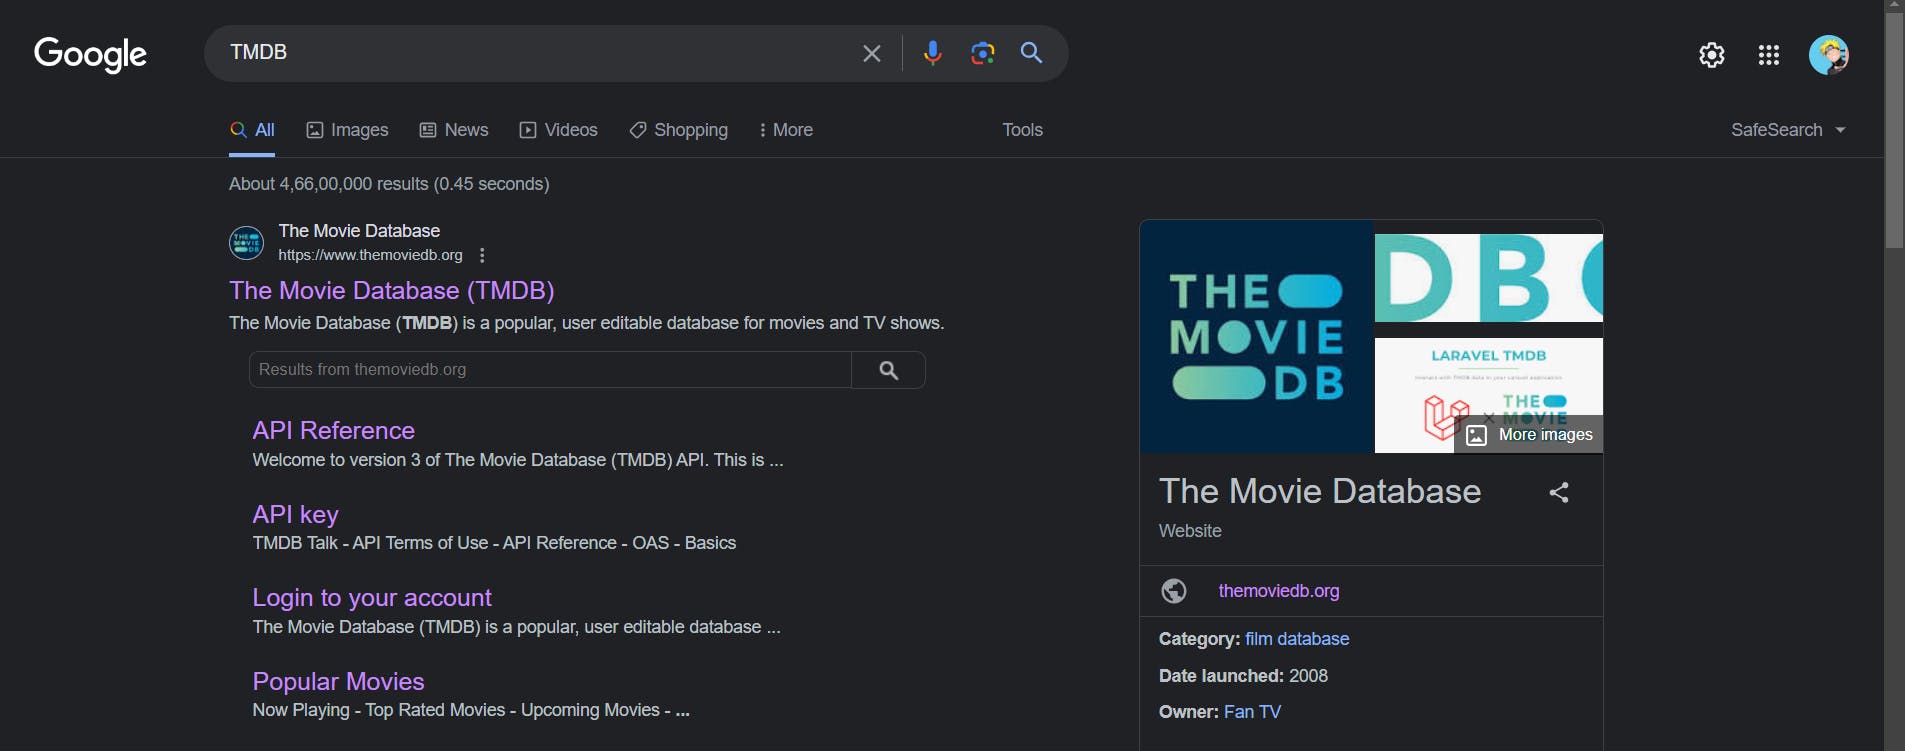
Click on the first result, you will see this page

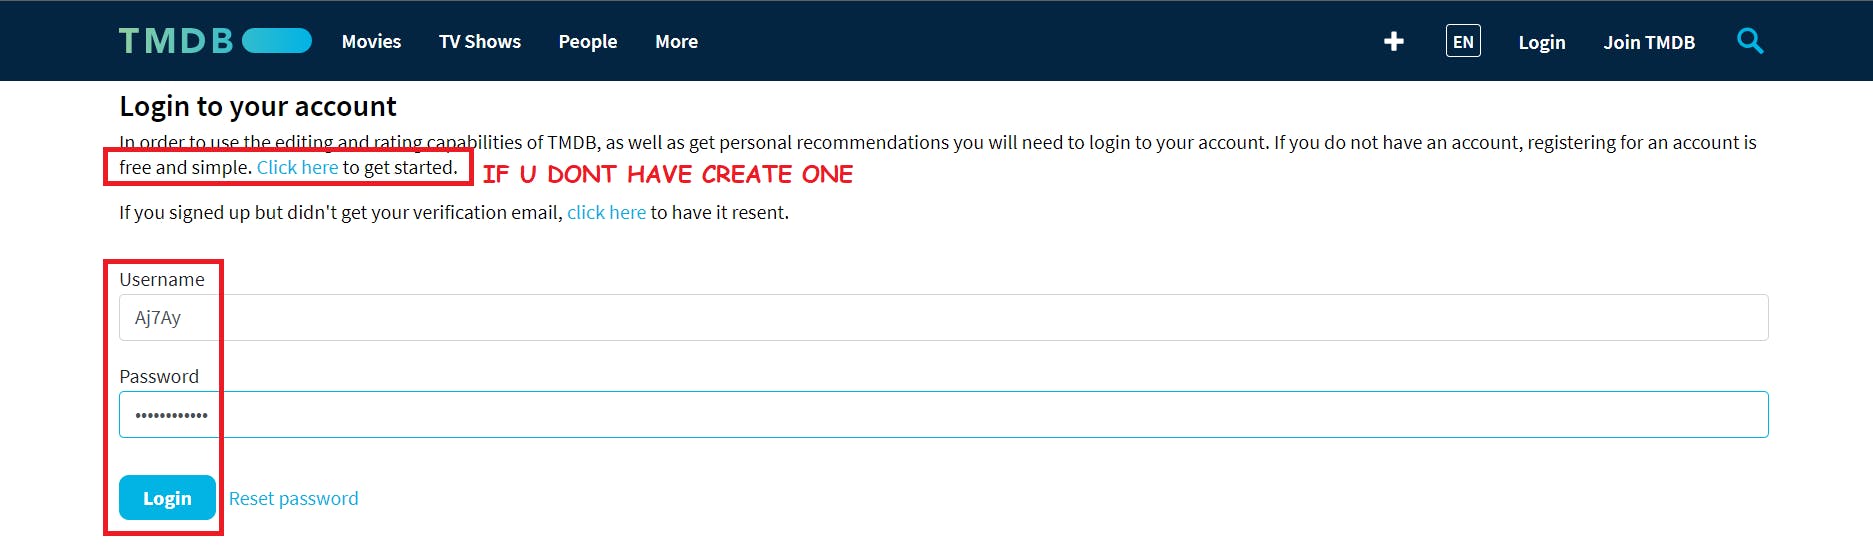
Click on the Login on the top right. You will get this page.
You need to create an account here. click on click here. I have account that’s why i added my details there.
once you create an account you will see this page.
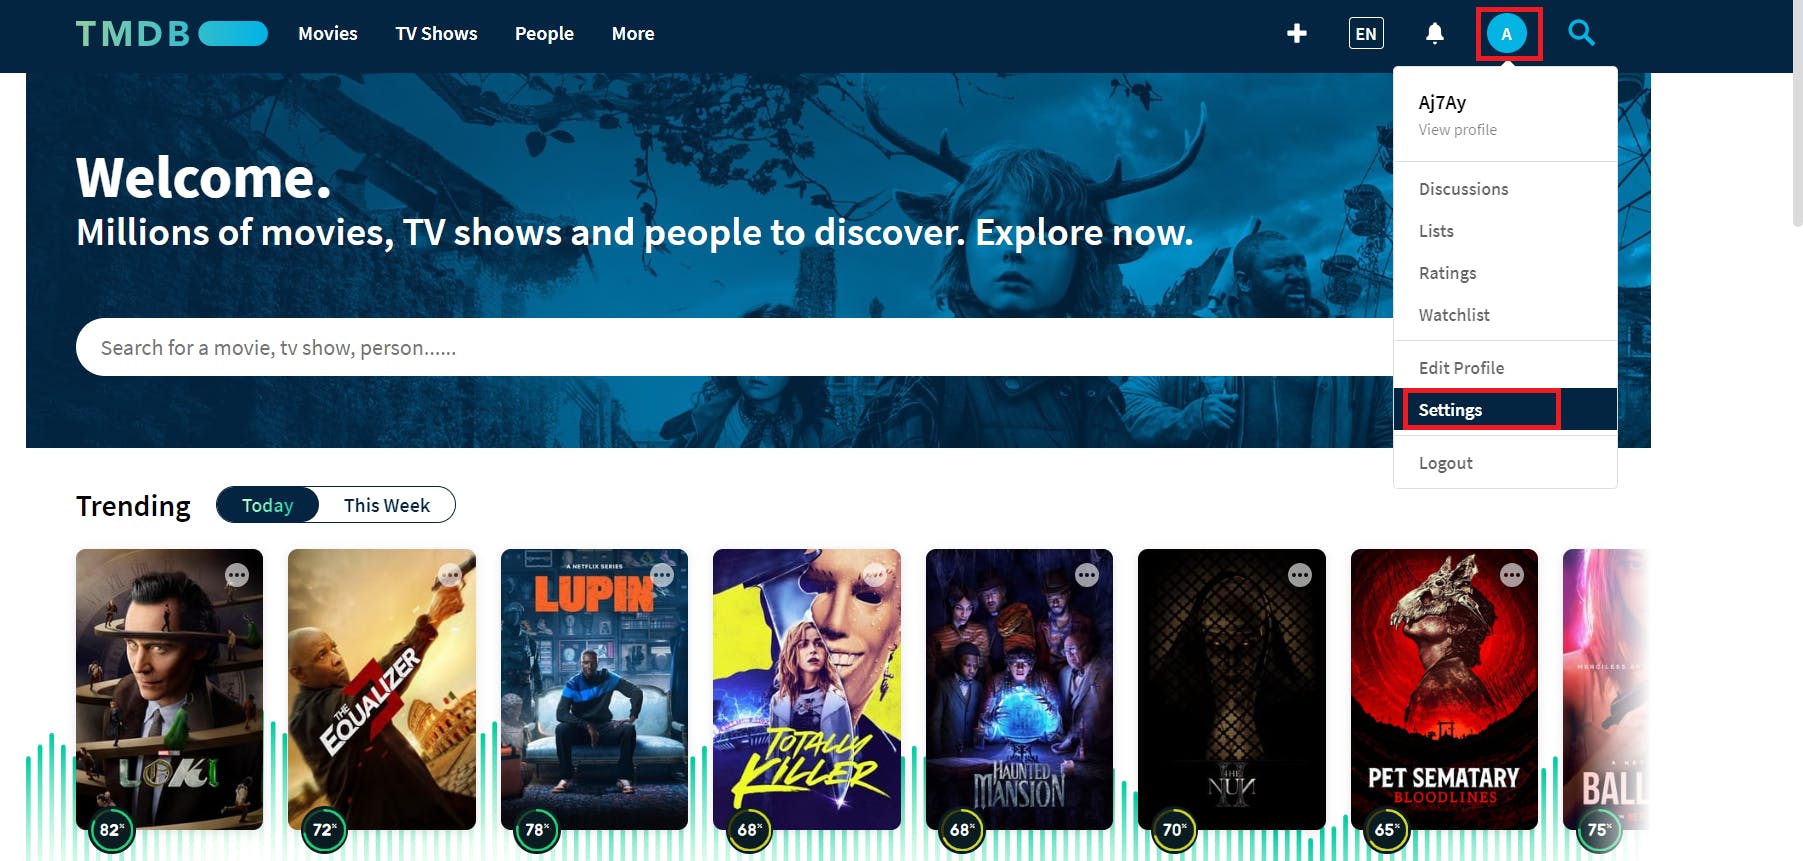
Let’s create an API key, By clicking on your profile and clicking settings.
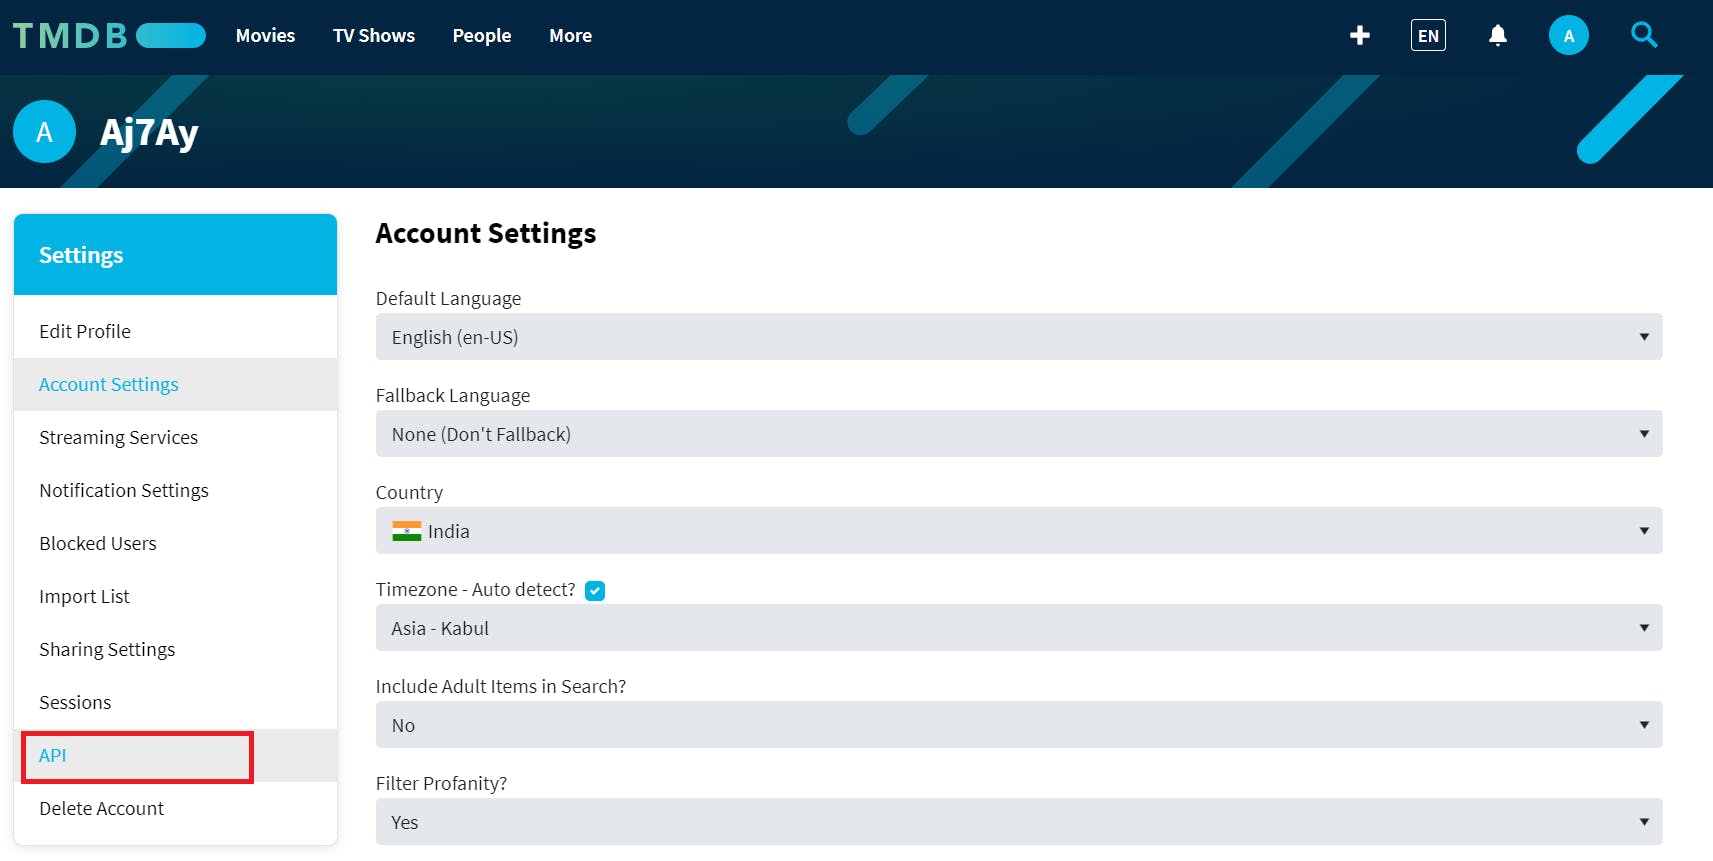
Now click on API from the left side panel.
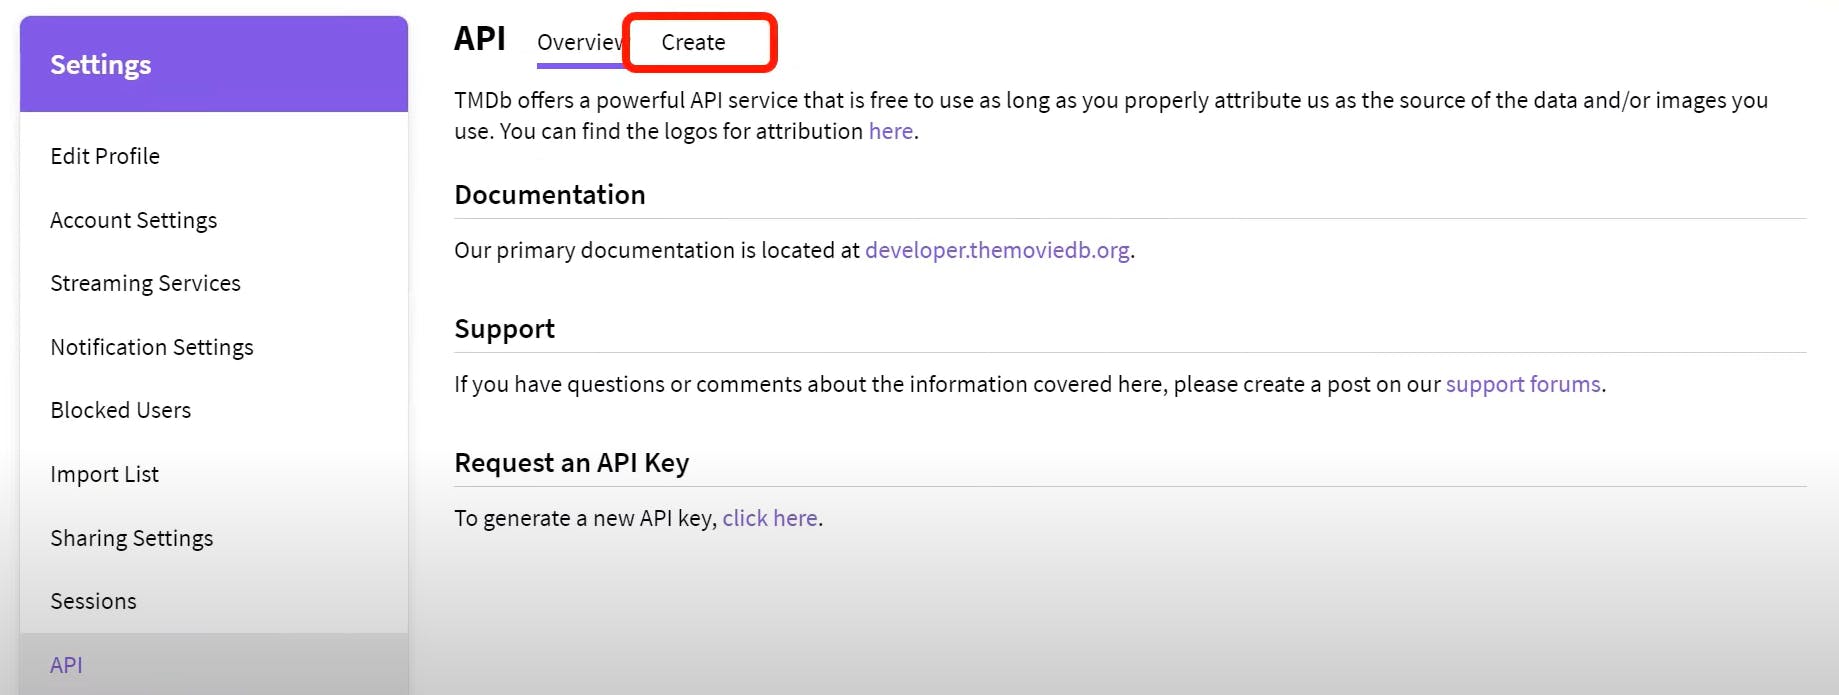
Now click on create
Click on Developer
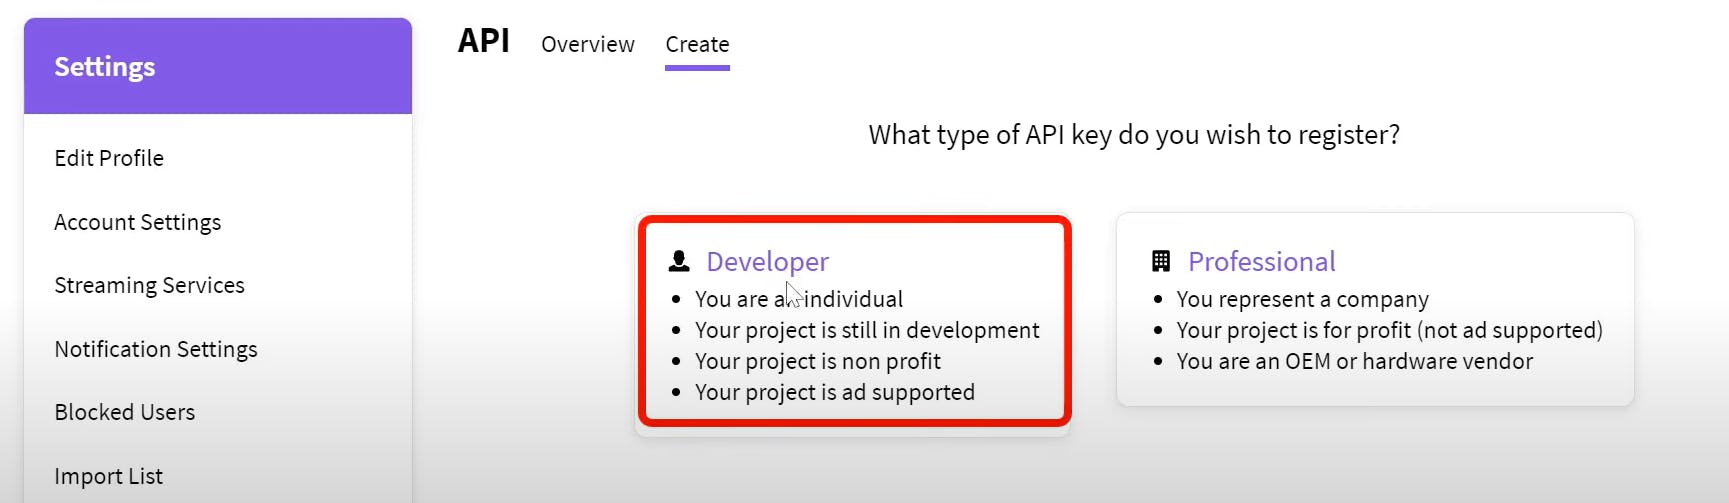
Now you have to accept the terms and conditions.
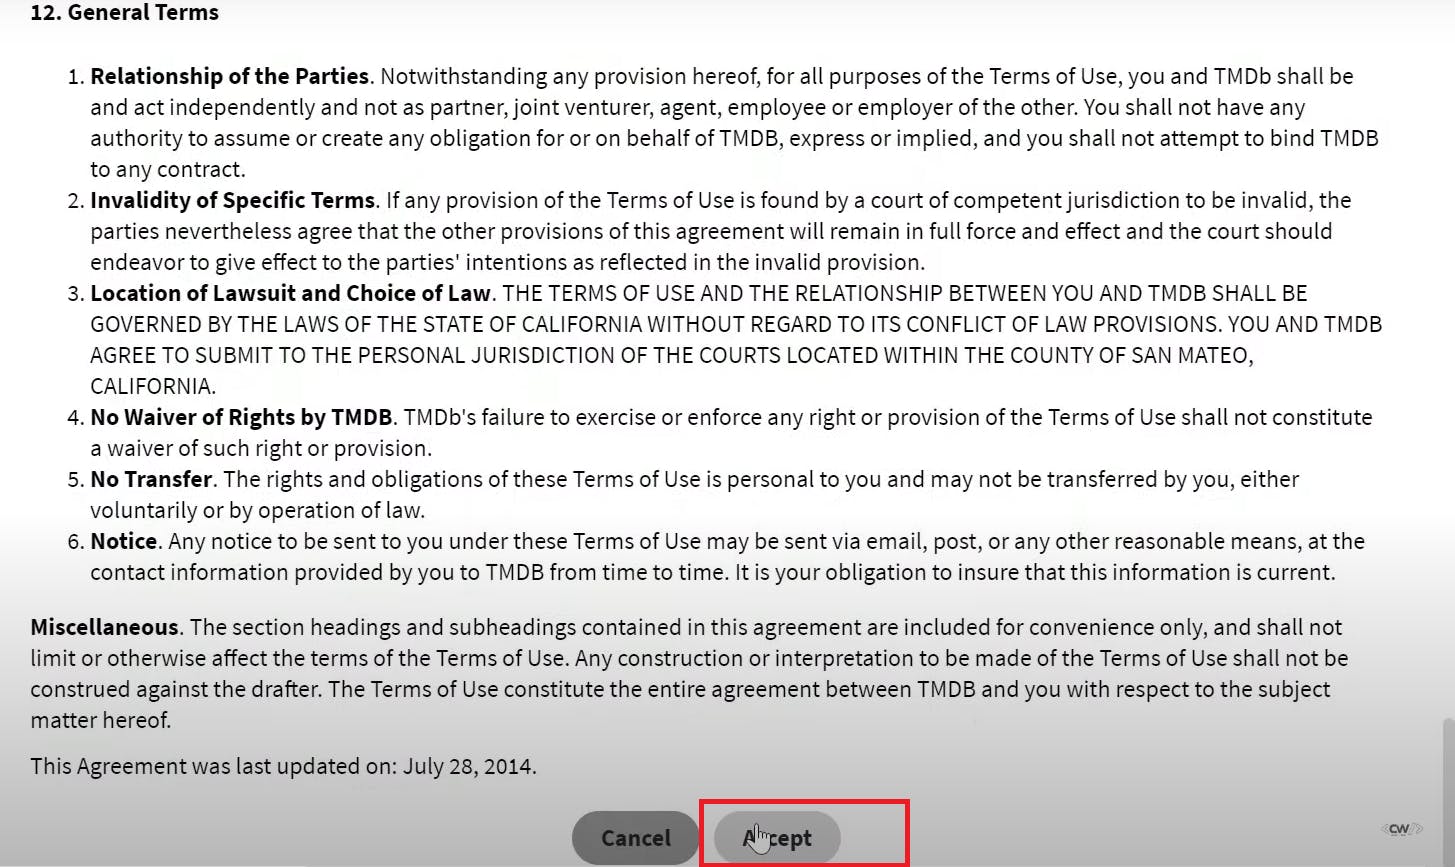
Provide basic details
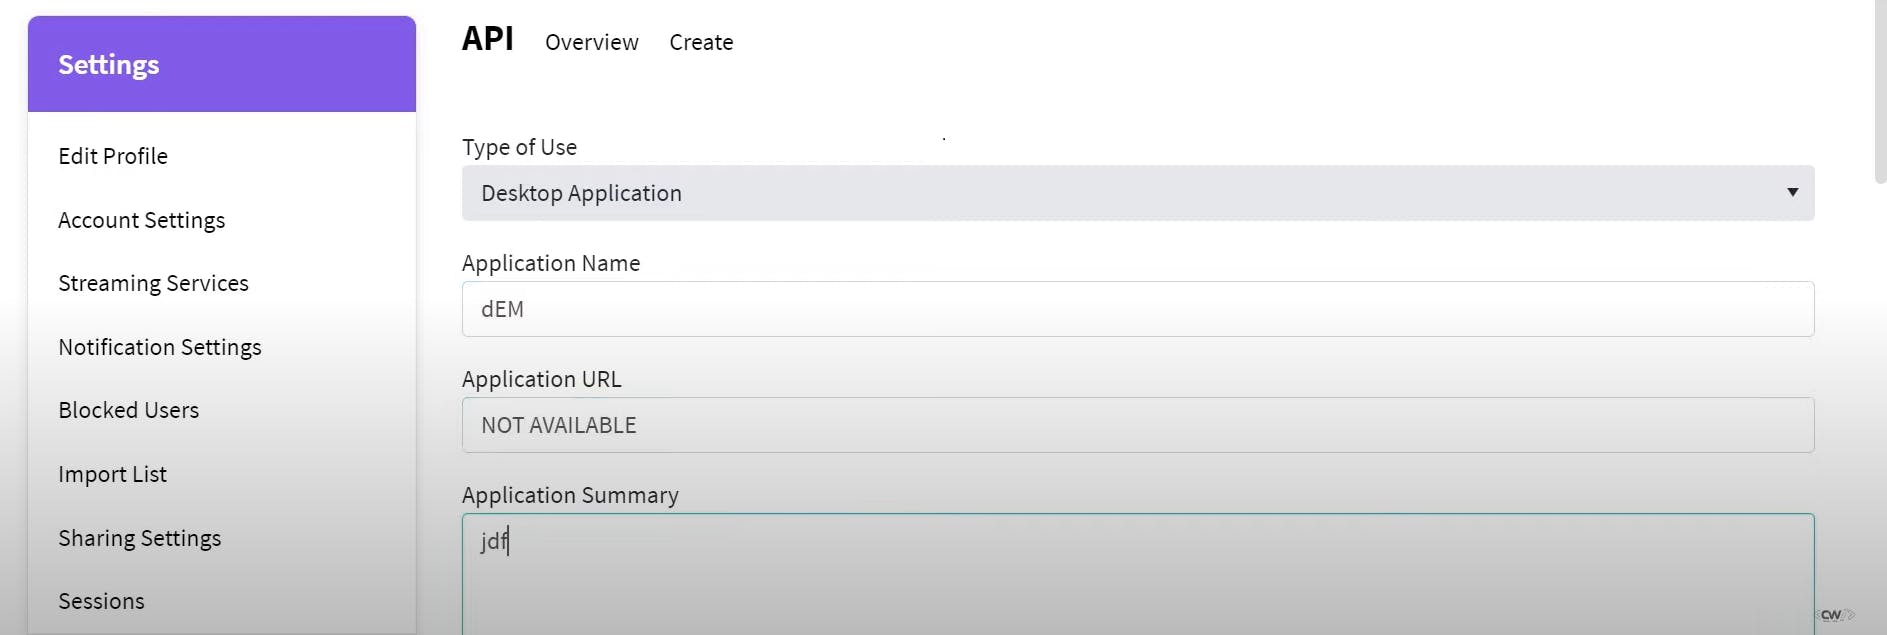

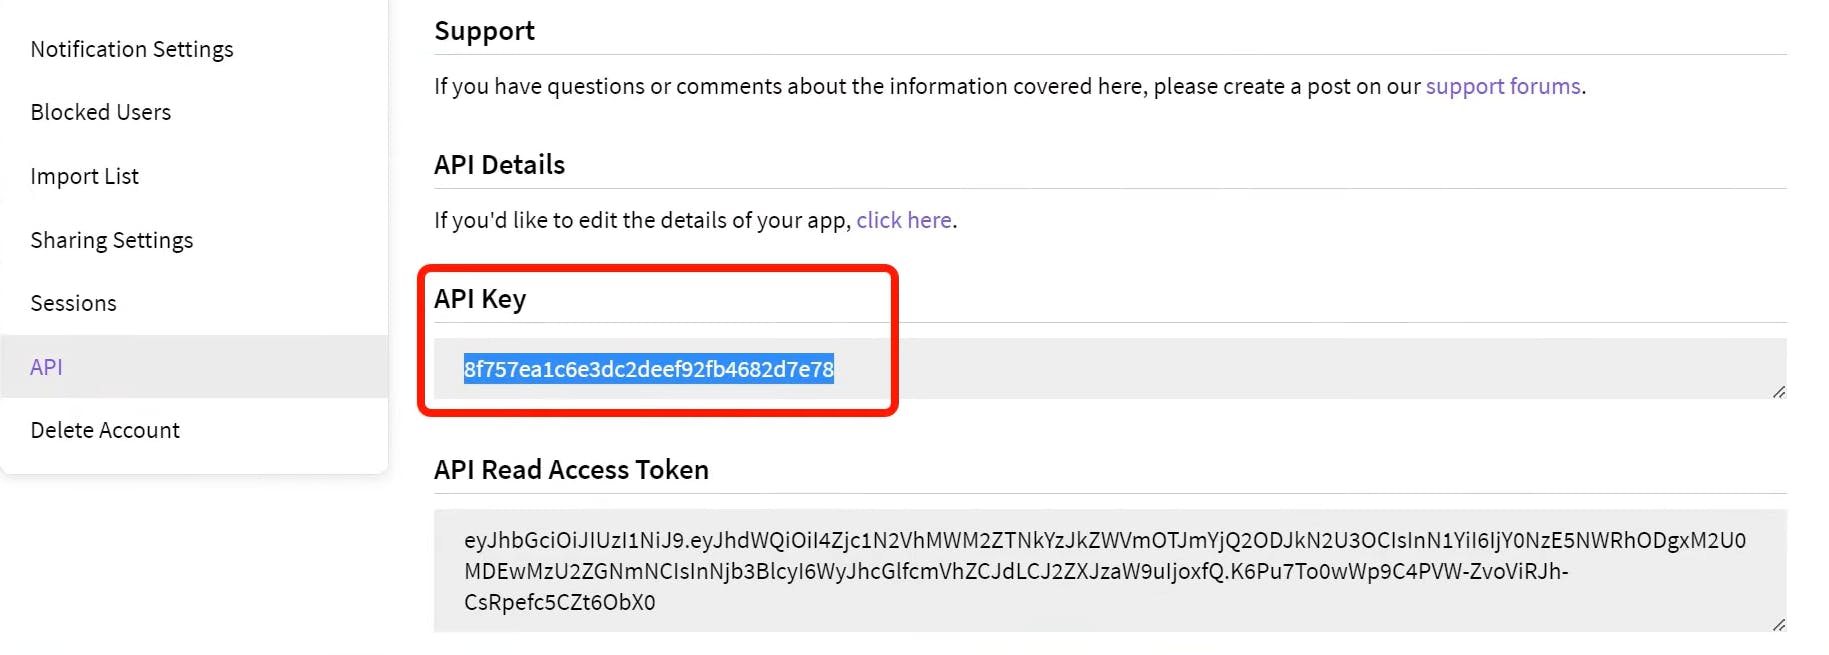
Click on submit and you will get your API key.
Step 4 - Install Prometheus and Grafana On the new Server
First of all, let’s create a dedicated Linux user sometimes called a system account for Prometheus. Having individual users for each service serves two main purposes:
It is a security measure to reduce the impact in case of an incident with the service.
It simplifies administration as it becomes easier to track down what resources belong to which service.
To create a system user or system account, run the following command:
sudo useradd \
    --system \
    --no-create-home \
    --shell /bin/false prometheus
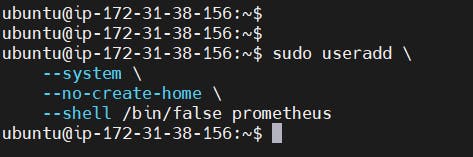
--system - Will create a system account.
--no-create-home - We don’t need a home directory for Prometheus or any other system accounts in our case.
--shell /bin/false - It prevents logging in as a Prometheus user.
Prometheus - Will create a Prometheus user and a group with the same name.
Let’s check the latest version of Prometheus from the download page.
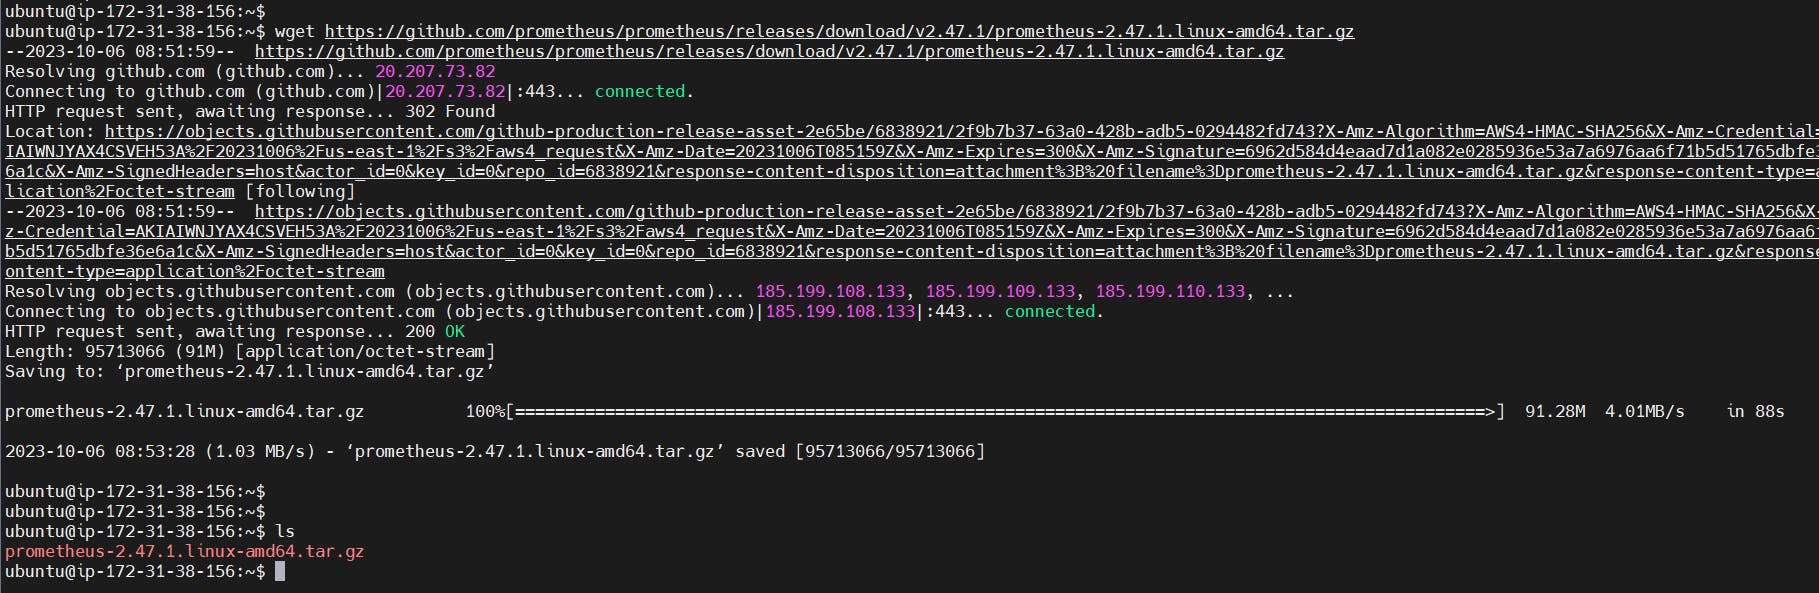
You can use the curl or wget command to download Prometheus.
wget https://github.com/prometheus/prometheus/releases/download/v2.47.1/prometheus-2.47.1.linux-amd64.tar.gz
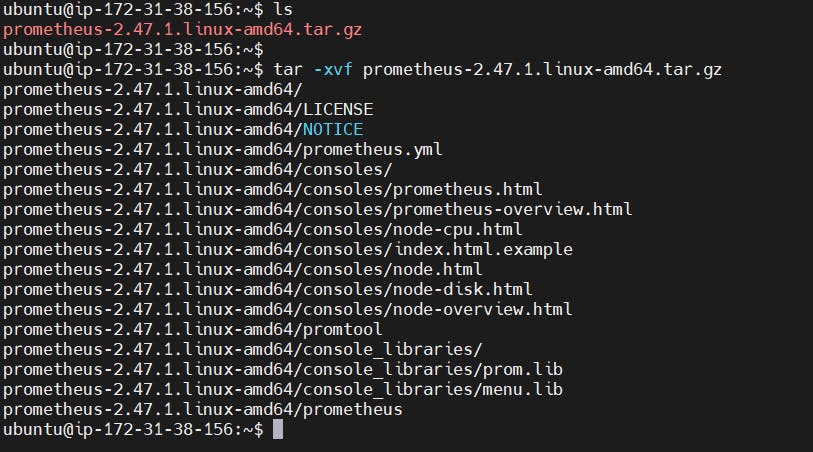
Then, we need to extract all Prometheus files from the archive.
tar -xvf prometheus-2.47.1.linux-amd64.tar.gz
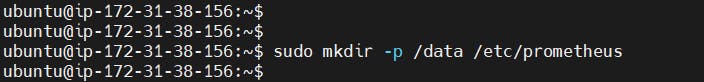
Usually, you would have a disk mounted to the data directory. For this tutorial, I will simply create a /data directory. Also, you need a folder for Prometheus configuration files.
sudo mkdir -p /data /etc/prometheus
Now, let’s change the directory to Prometheus and move some files.
cd prometheus-2.47.1.linux-amd64/
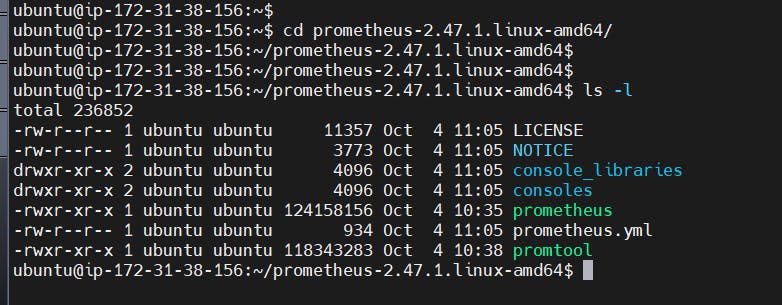
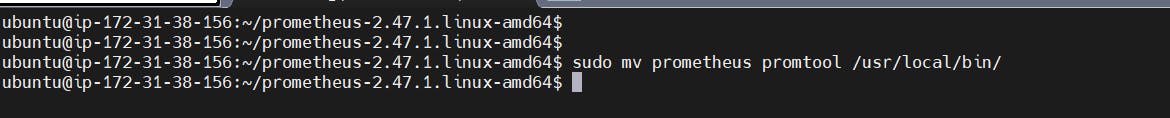
First of all, let’s move the Prometheus binary and a promtool to the /usr/local/bin/. promtool is used to check configuration files and Prometheus rules.
sudo mv prometheus promtool /usr/local/bin/
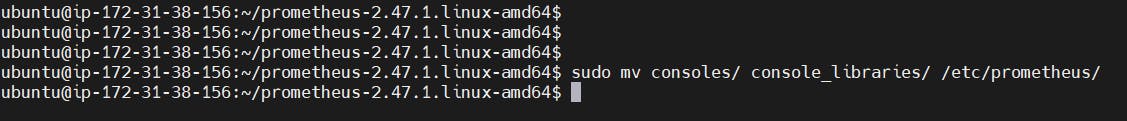
Optionally, we can move console libraries to the Prometheus configuration directory. Console templates allow for the creation of arbitrary consoles using the Go templating language. You don’t need to worry about it if you’re just getting started.
sudo mv consoles/ console_libraries/ /etc/prometheus/
Finally, let’s move the example of the main Prometheus configuration file.
sudo mv prometheus.yml /etc/prometheus/prometheus.yml

To avoid permission issues, you need to set the correct ownership for the /etc/prometheus/ and data directory.
sudo chown -R prometheus:prometheus /etc/prometheus/ /data/

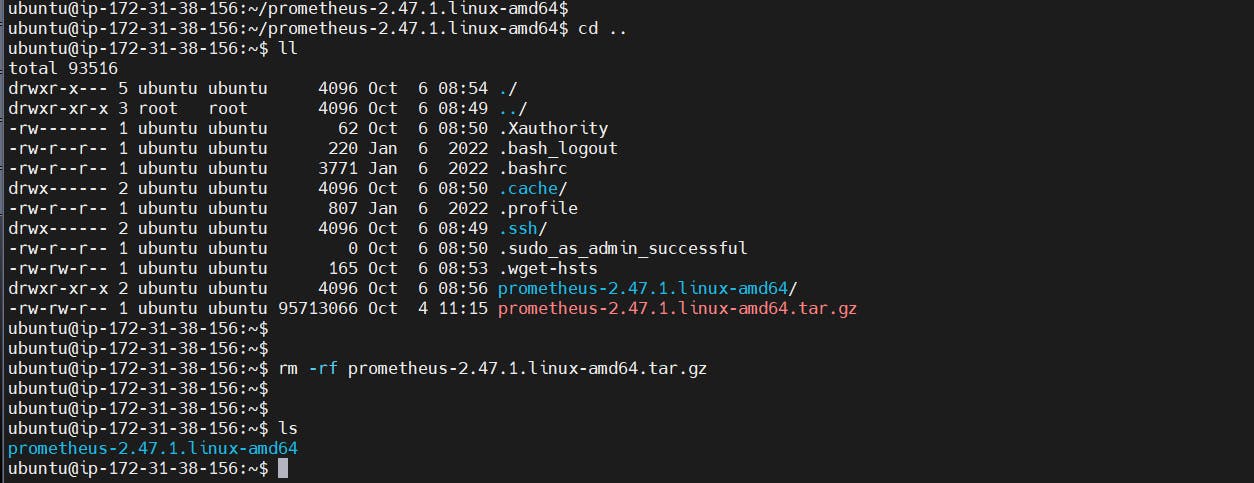
You can delete the archive and a Prometheus folder when you are done.
cd
rm -rf prometheus-2.47.1.linux-amd64.tar.gz
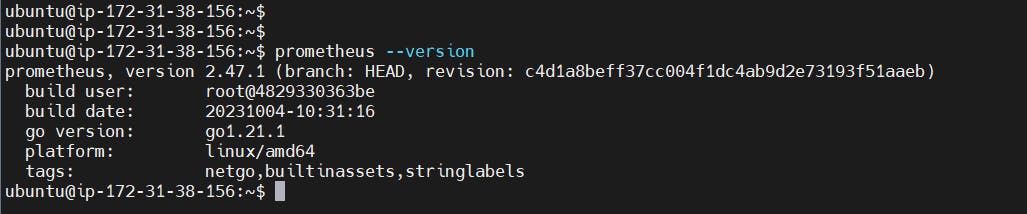
Verify that you can execute the Prometheus binary by running the following command:
prometheus --version
To get more information and configuration options, run Prometheus Help.
prometheus --help
We’re going to use some of these options in the service definition.
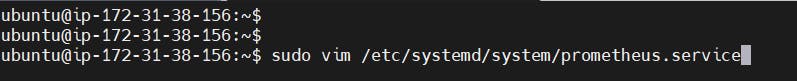
We’re going to use Systemd, which is a system and service manager for Linux operating systems. For that, we need to create a Systemd unit configuration file.
sudo vim /etc/systemd/system/prometheus.service
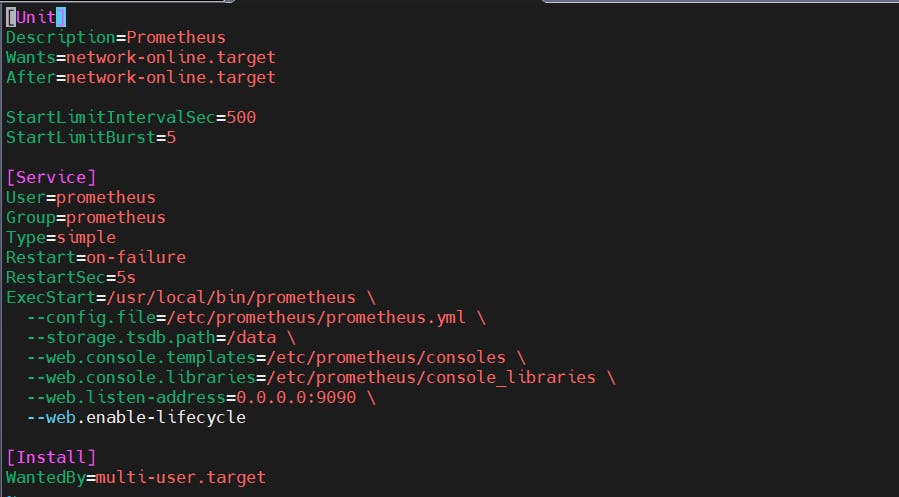
Prometheus.service
[Unit]
Description=Prometheus
Wants=network-online.target
After=network-online.target
StartLimitIntervalSec=500
StartLimitBurst=5
[Service]
User=prometheus
Group=prometheus
Type=simple
Restart=on-failure
RestartSec=5s
ExecStart=/usr/local/bin/prometheus \
  --config.file=/etc/prometheus/prometheus.yml \
  --storage.tsdb.path=/data \
  --web.console.templates=/etc/prometheus/consoles \
  --web.console.libraries=/etc/prometheus/console_libraries \
  --web.listen-address=0.0.0.0:9090 \
  --web.enable-lifecycle
[Install]
WantedBy=multi-user.target
Let’s go over a few of the most important options related to Systemd and Prometheus. Restart - Configures whether the service shall be restarted when the service process exits, is killed, or a timeout is reached.
RestartSec - Configures the time to sleep before restarting a service.
User and Group - Are Linux user and a group to start a Prometheus process.
--config.file=/etc/prometheus/prometheus.yml - Path to the main Prometheus configuration file.
--storage.tsdb.path=/data - Location to store Prometheus data.
--web.listen-address=0.0.0.0:9090 - Configure to listen on all network interfaces. In some situations, you may have a proxy such as nginx to redirect requests to Prometheus. In that case, you would configure Prometheus to listen only on localhost.
--web.enable-lifecycle -- Allows to manage Prometheus, for example, to reload configuration without restarting the service.
To automatically start the Prometheus after reboot, run enable.
sudo systemctl enable prometheus

Then just start the Prometheus.
sudo systemctl start prometheus
To check the status of Prometheus run the following command:
sudo systemctl status prometheus
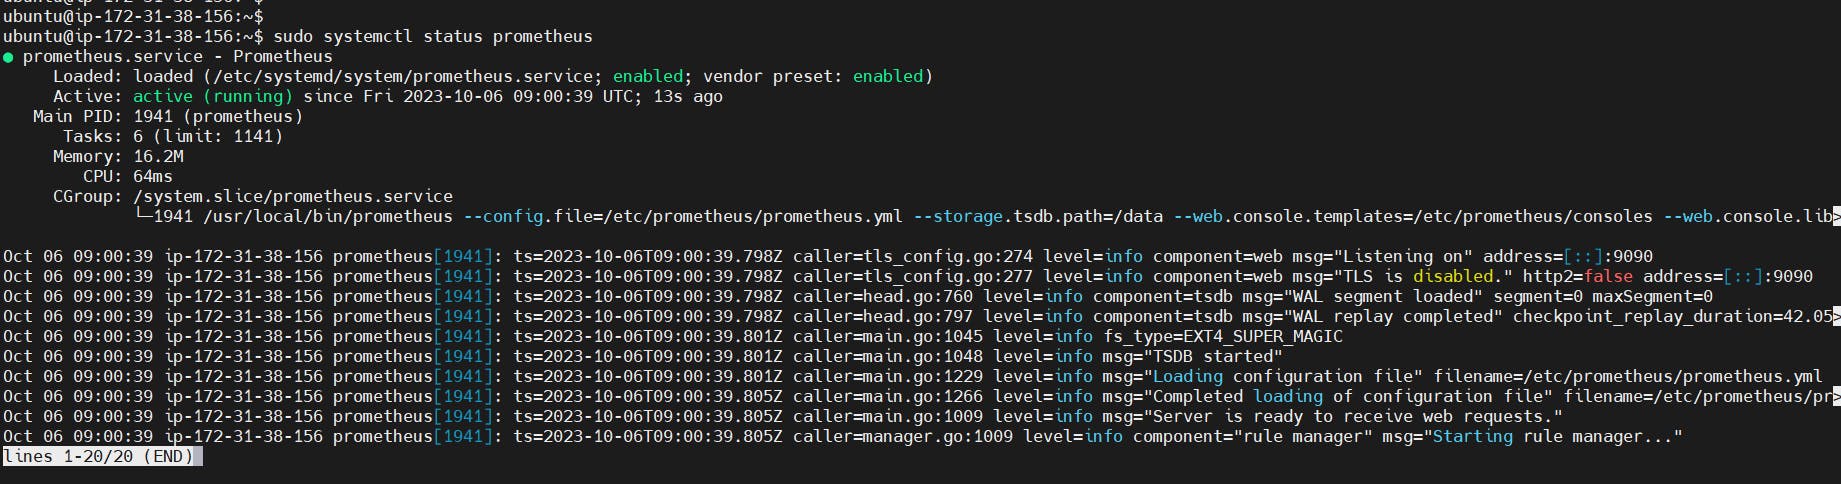
Suppose you encounter any issues with Prometheus or are unable to start it. The easiest way to find the problem is to use the journalctl command and search for errors.
journalctl -u prometheus -f --no-pager
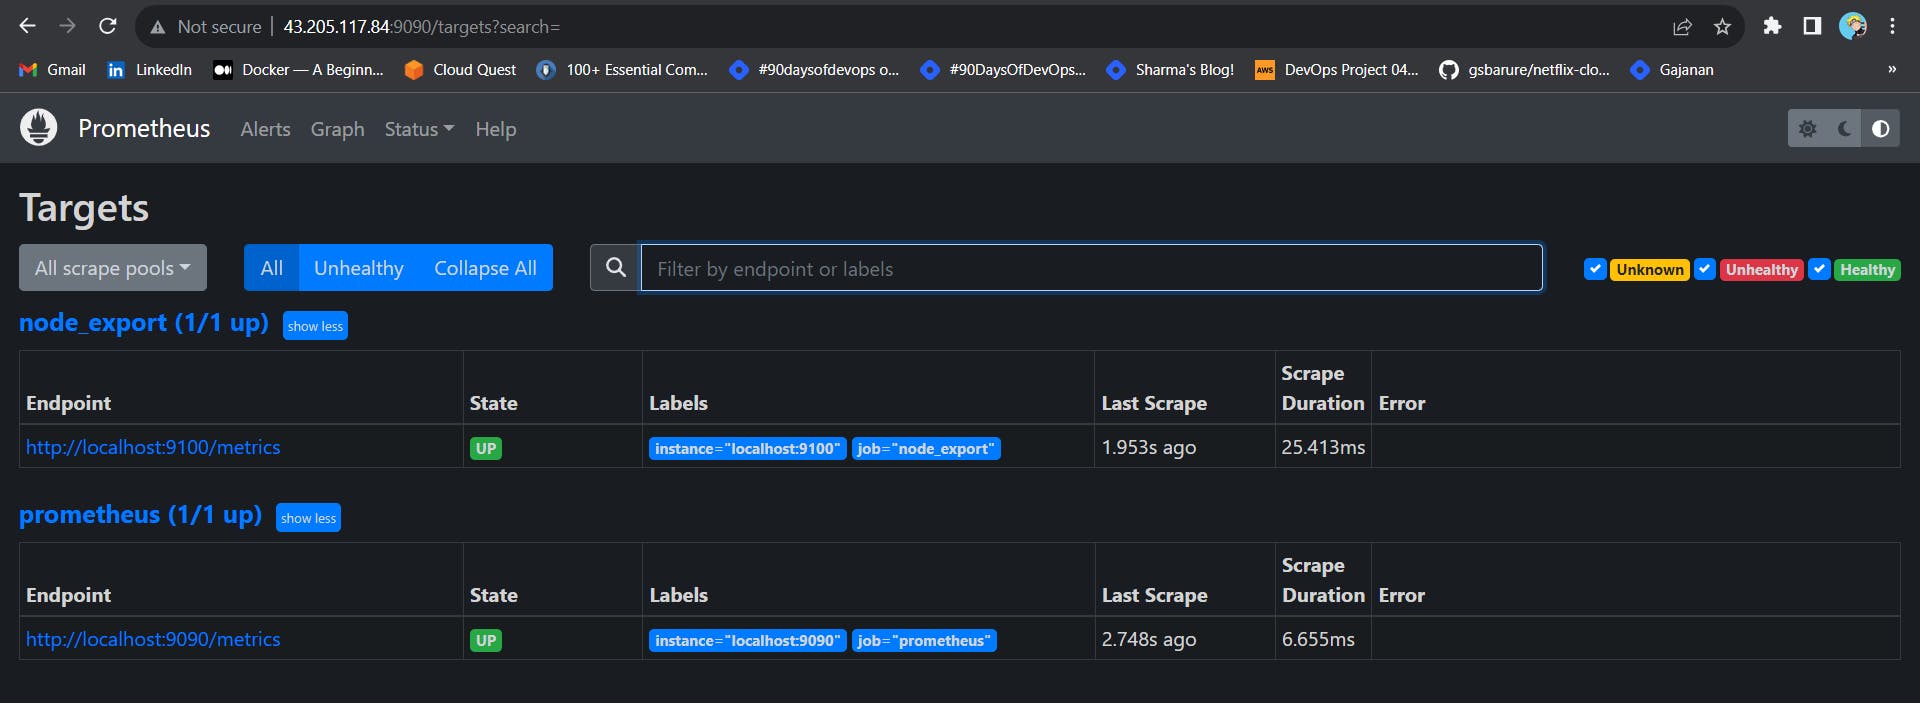
Now we can try to access it via the browser. I’m going to be using the IP address of the Ubuntu server. You need to append port 9090 to the IP.
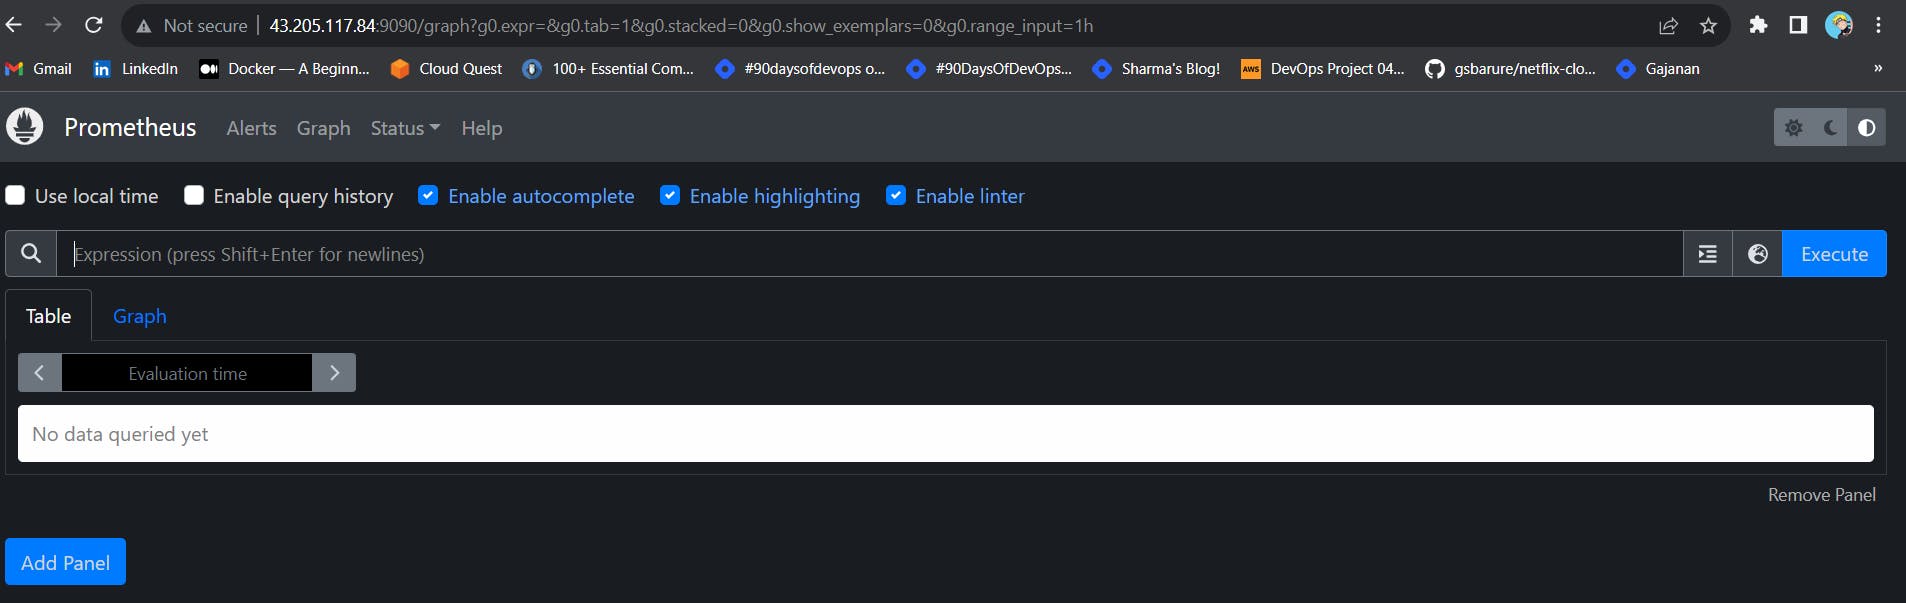
If you go to targets, you should see only one - Prometheus target. It scrapes itself every 15 seconds by default.
Install Node Exporter on Ubuntu 22.04
Next, we’re going to set up and configure Node Exporter to collect Linux system metrics like CPU load and disk I/O. Node Exporter will expose these as Prometheus-style metrics. Since the installation process is very similar, I’m not going to cover as deep as Prometheus.
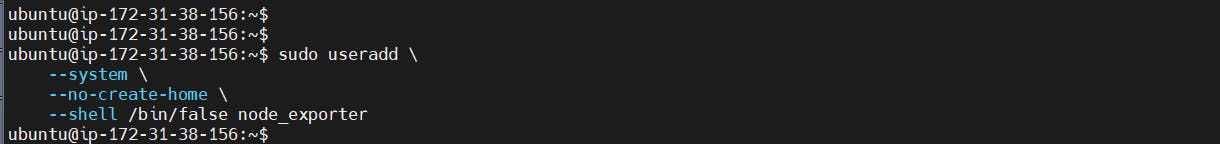
First, let’s create a system user for Node Exporter by running the following command:
sudo useradd \
    --system \
    --no-create-home \
    --shell /bin/false node_exporter
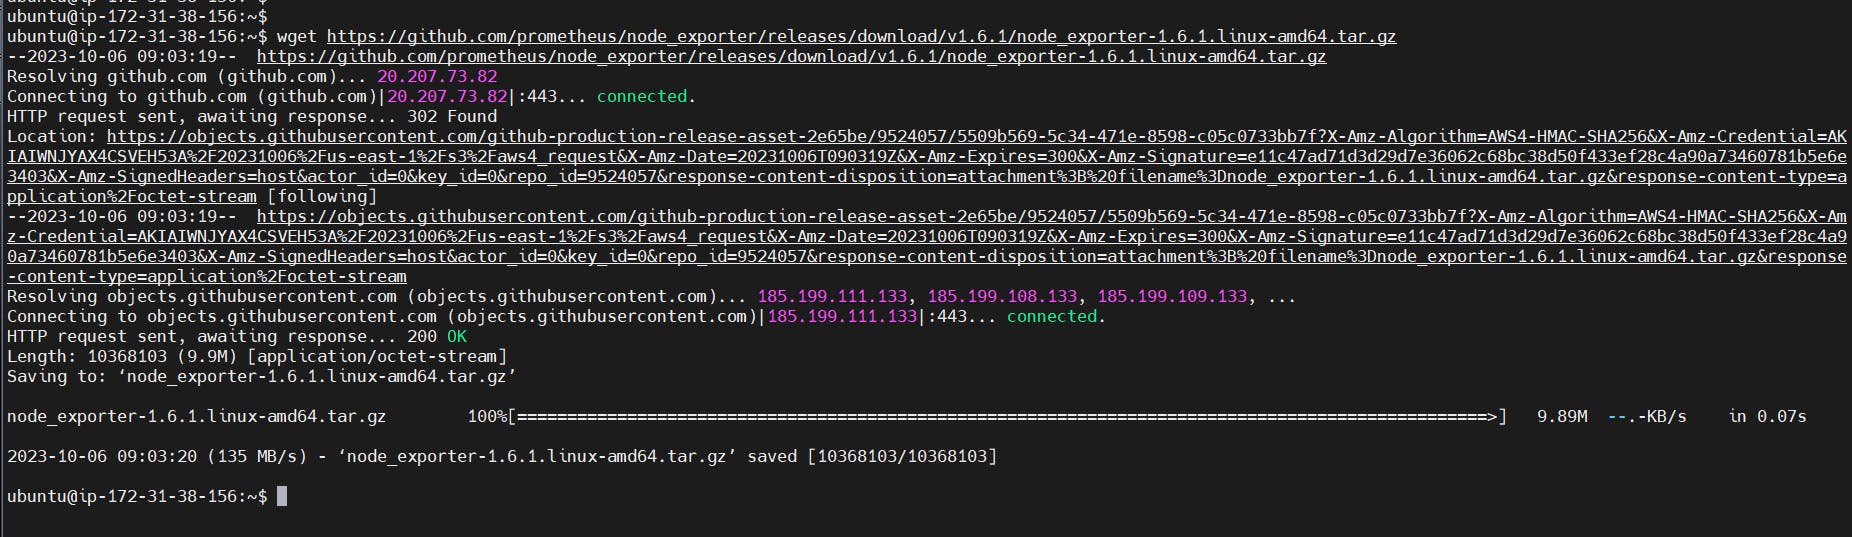
You can download Node Exporter from the same page.
Use the wget command to download the binary.
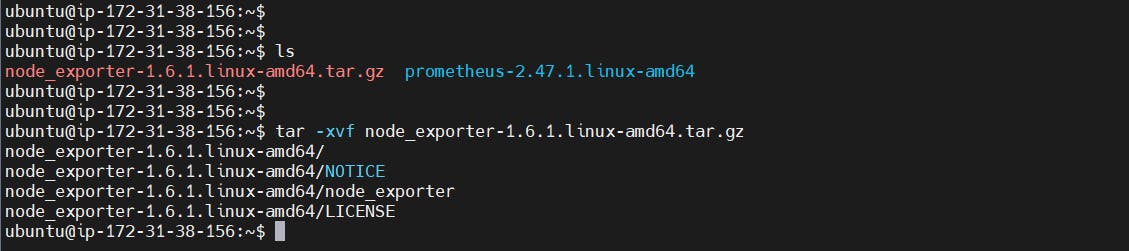
wget https://github.com/prometheus/node_exporter/releases/download/v1.6.1/node_exporter-1.6.1.linux-amd64.tar.gz
Extract the node exporter from the archive.
tar -xvf node_exporter-1.6.1.linux-amd64.tar.gz
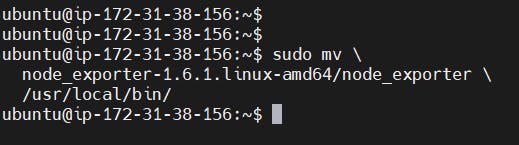
Move binary to the /usr/local/bin.
sudo mv \
  node_exporter-1.6.1.linux-amd64/node_exporter \
  /usr/local/bin/
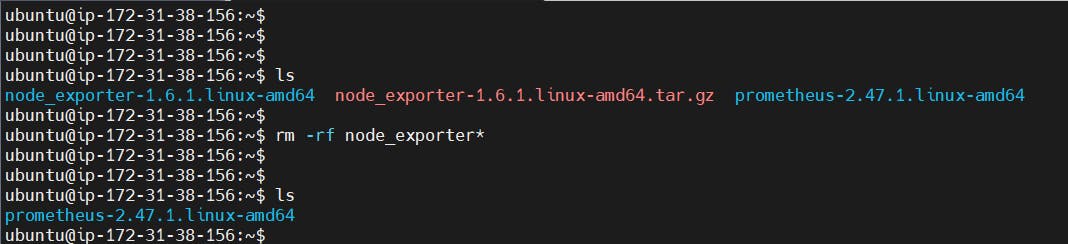
Clean up, and delete node_exporter archive and a folder.
rm -rf node_exporter*
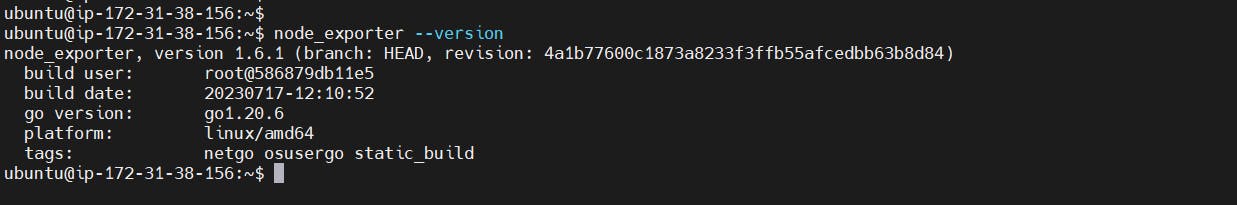
Verify that you can run the binary.
node_exporter --version
Node Exporter has a lot of plugins that we can enable. If you run Node Exporter help you will get all the options.
node_exporter --help
--collector.logind We’re going to enable the login controller, just for the demo.
Next, create a similar systemd unit file.
sudo vim /etc/systemd/system/node_exporter.service

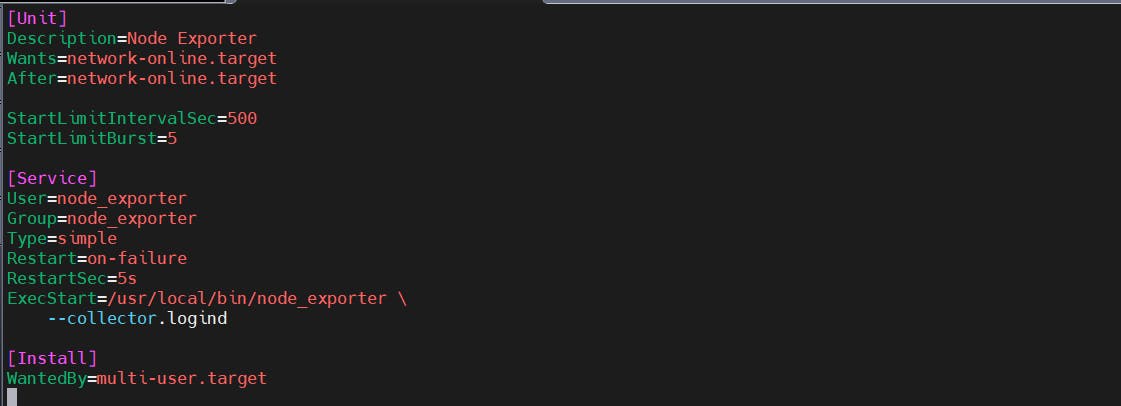
node_exporter.service
[Unit]
Description=Node Exporter
Wants=network-online.target
After=network-online.target
StartLimitIntervalSec=500
StartLimitBurst=5
[Service]
User=node_exporter
Group=node_exporter
Type=simple
Restart=on-failure
RestartSec=5s
ExecStart=/usr/local/bin/node_exporter \
    --collector.logind
[Install]
WantedBy=multi-user.target
Replace Prometheus user and group to node_exporter, and update the ExecStart command.
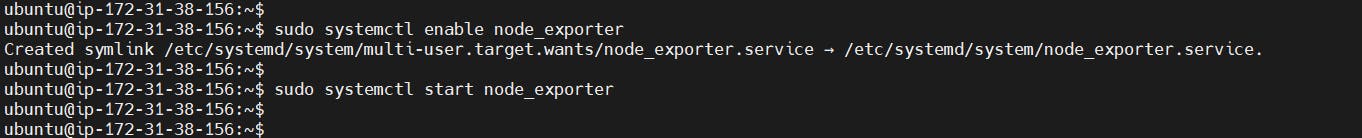
To automatically start the Node Exporter after reboot, enable the service.
sudo systemctl enable node_exporter
Then start the Node Exporter.
sudo systemctl start node_exporter
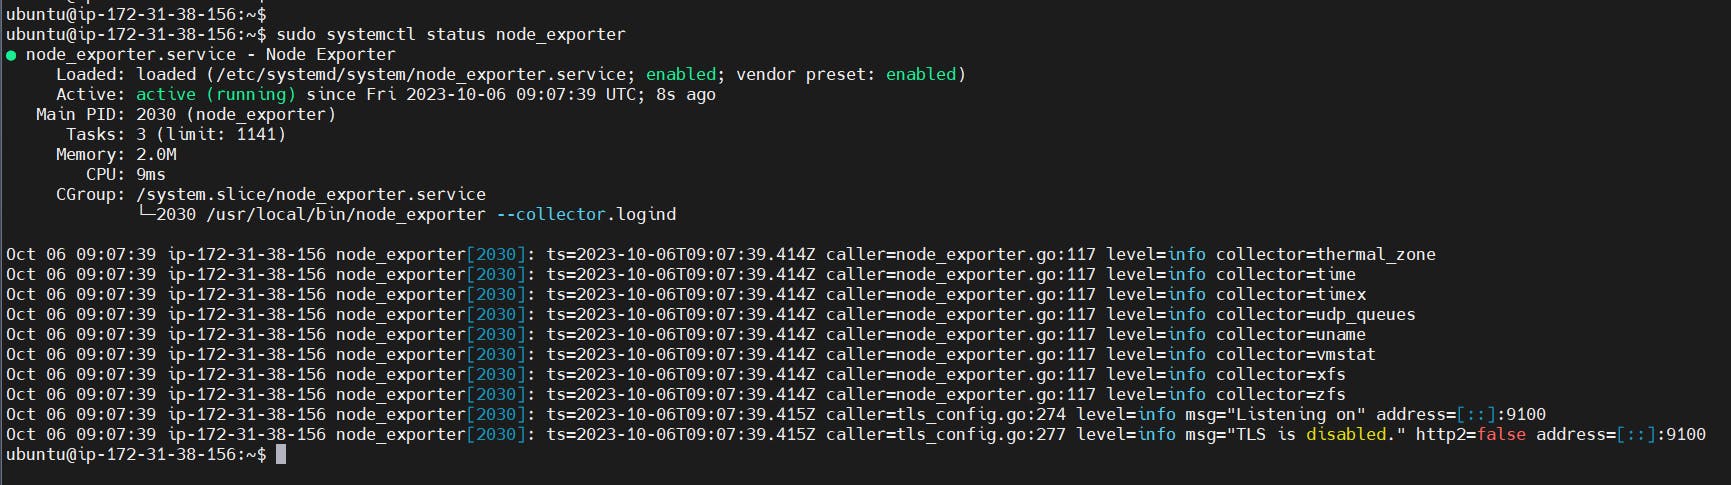
Check the status of Node Exporter with the following command:
sudo systemctl status node_exporter
If you have any issues, check logs with journalctl
journalctl -u node_exporter -f --no-pager
At this point, we have only a single target in our Prometheus. There are many different service discovery mechanisms built into Prometheus. For example, Prometheus can dynamically discover targets in AWS, GCP, and other clouds based on the labels. In the following tutorials, I’ll give you a few examples of deploying Prometheus in a cloud-specific environment. For this tutorial, let’s keep it simple and keep adding static targets. Also, I have a lesson on how to deploy and manage Prometheus in the Kubernetes cluster.
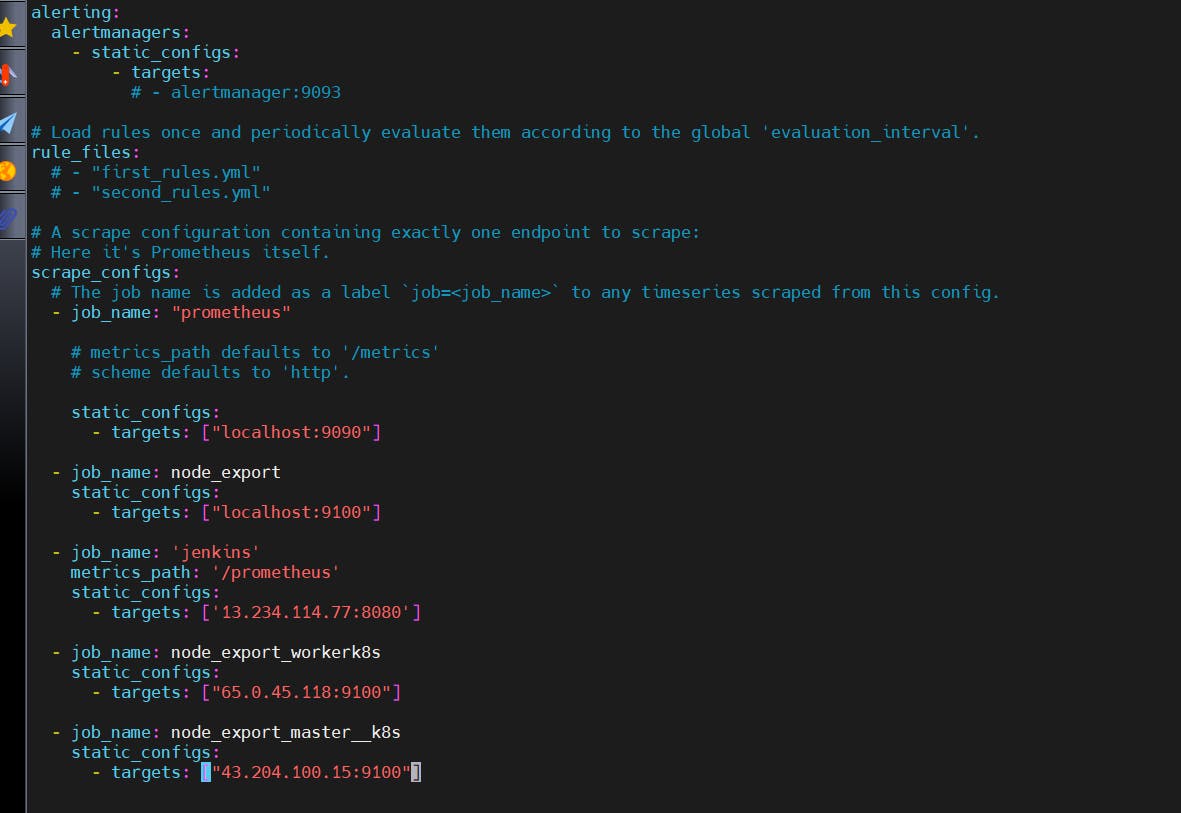
To create a static target, you need to add job_name with static_configs.
sudo vim /etc/prometheus/prometheus.yml
prometheus.yml
- job_name: node_export
    static_configs:
      - targets: ["localhost:9100"]
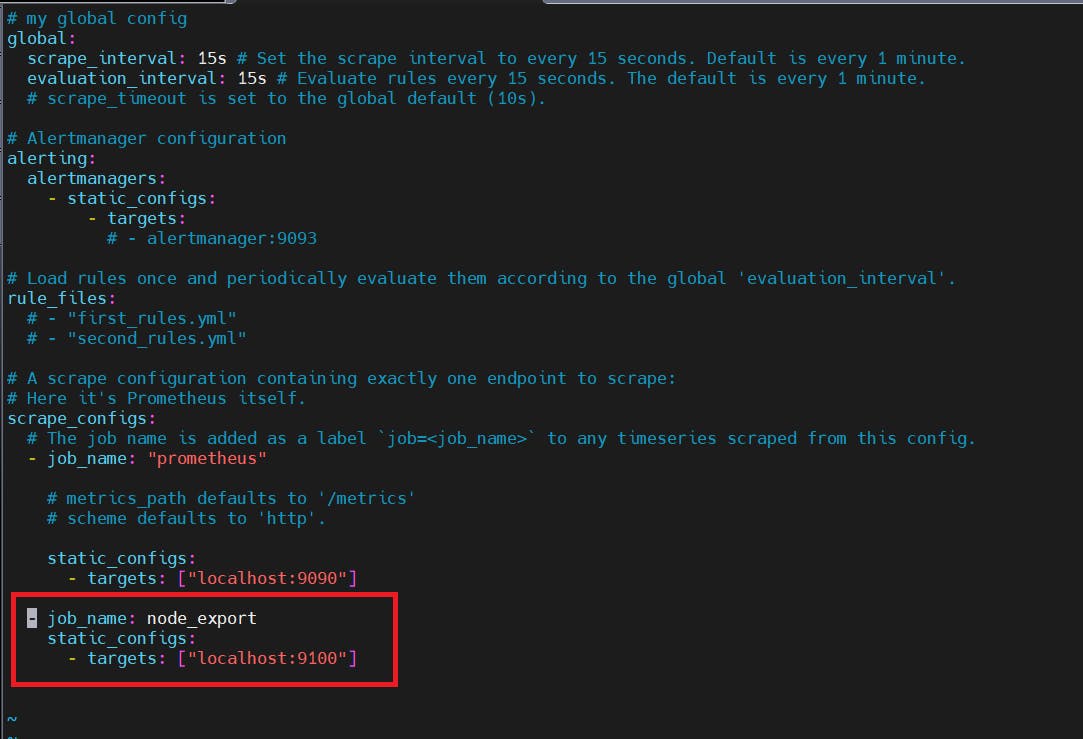
By default, Node Exporter will be exposed on port 9100.
Since we enabled lifecycle management via API calls, we can reload the Prometheus config without restarting the service and causing downtime.
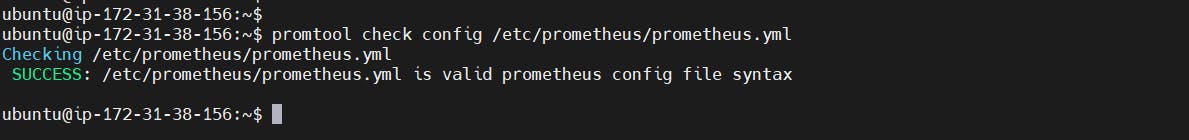
Before, restarting check if the config is valid.
promtool check config /etc/prometheus/prometheus.yml

Then, you can use a POST request to reload the config.
curl -X POST http://localhost:9090/-/reload

Check the targets section
http://:9090/targets
Install Grafana on Ubuntu 22.04
To visualize metrics we can use Grafana. There are many different data sources that Grafana supports, one of them is Prometheus.
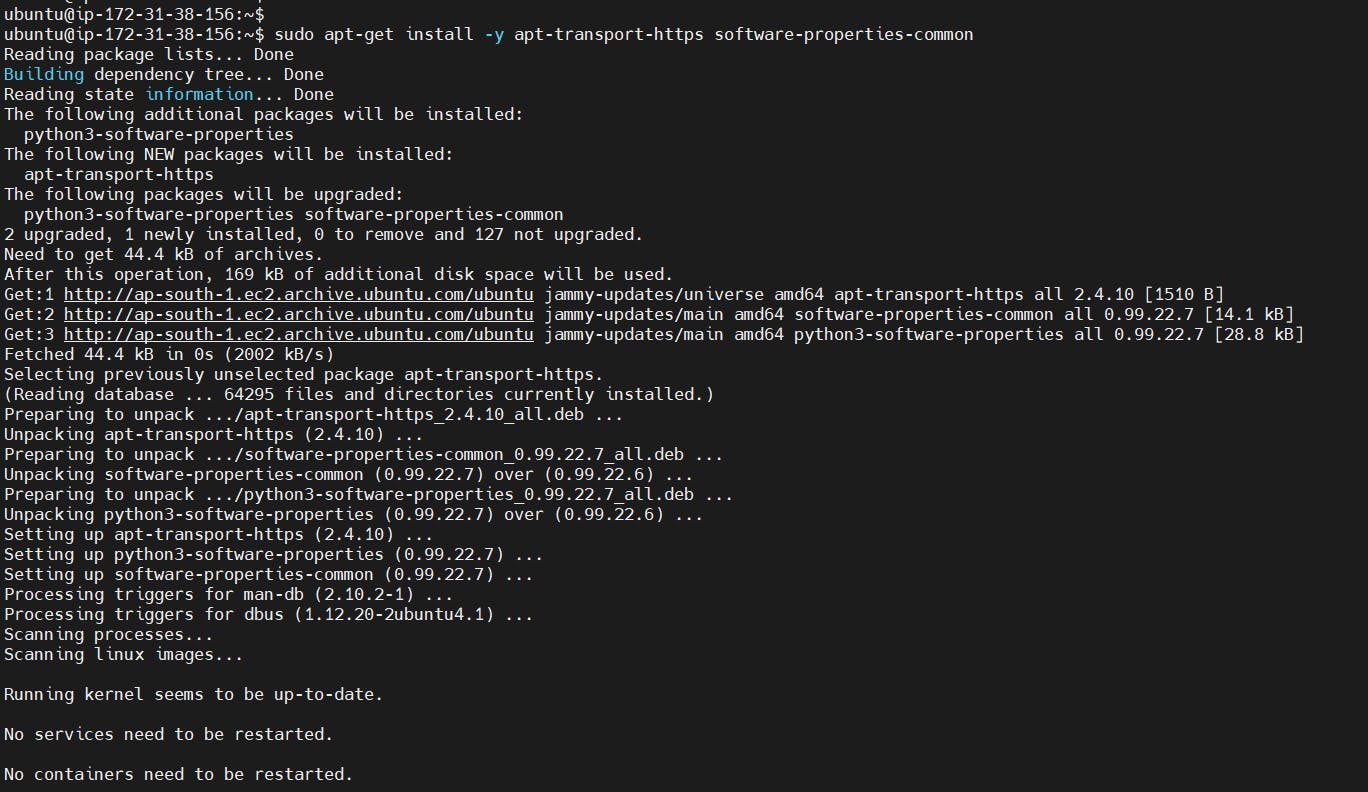
First, let’s make sure that all the dependencies are installed.
sudo apt-get install -y apt-transport-https software-properties-common
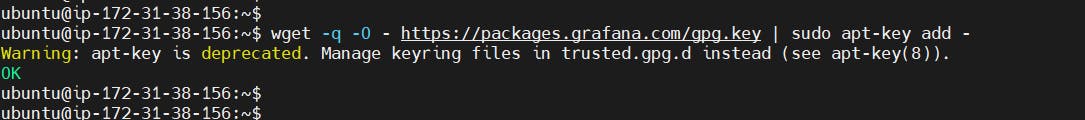
Next, add the GPG key.
wget -q -O - https://packages.grafana.com/gpg.key | sudo apt-key add -
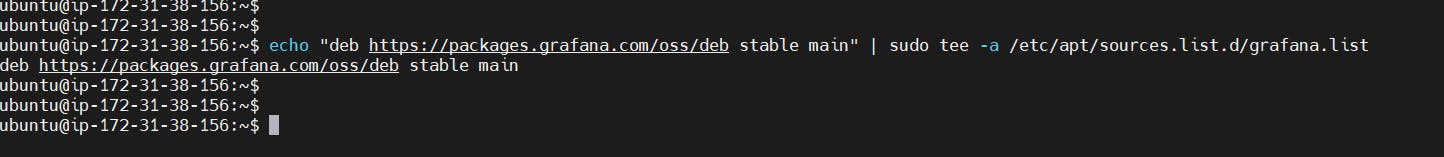
Add this repository for stable releases.
echo "deb https://packages.grafana.com/oss/deb stable main" | sudo tee -a /etc/apt/sources.list.d/grafana.list
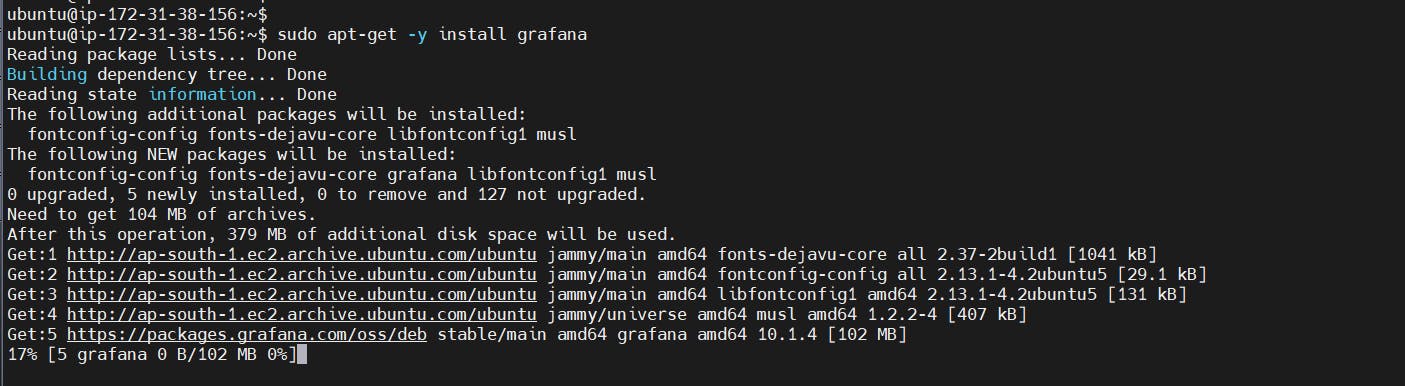
After you add the repository, update and install Garafana.
sudo apt-get update
sudo apt-get -y install grafana
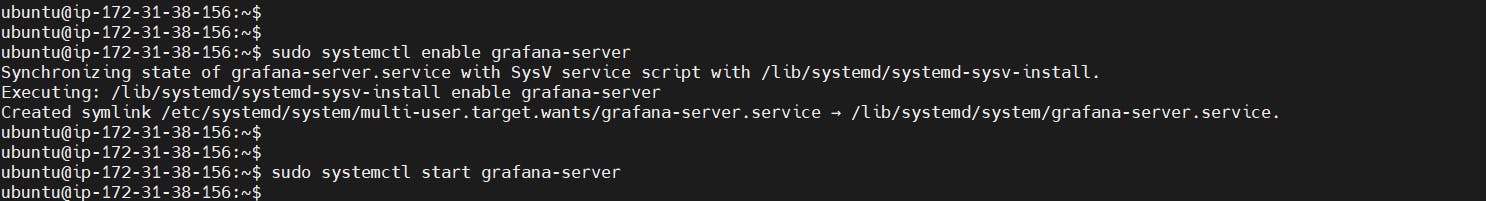
To automatically start the Grafana after reboot, enable the service.
sudo systemctl enable grafana-server
Then start the Grafana.
sudo systemctl start grafana-server
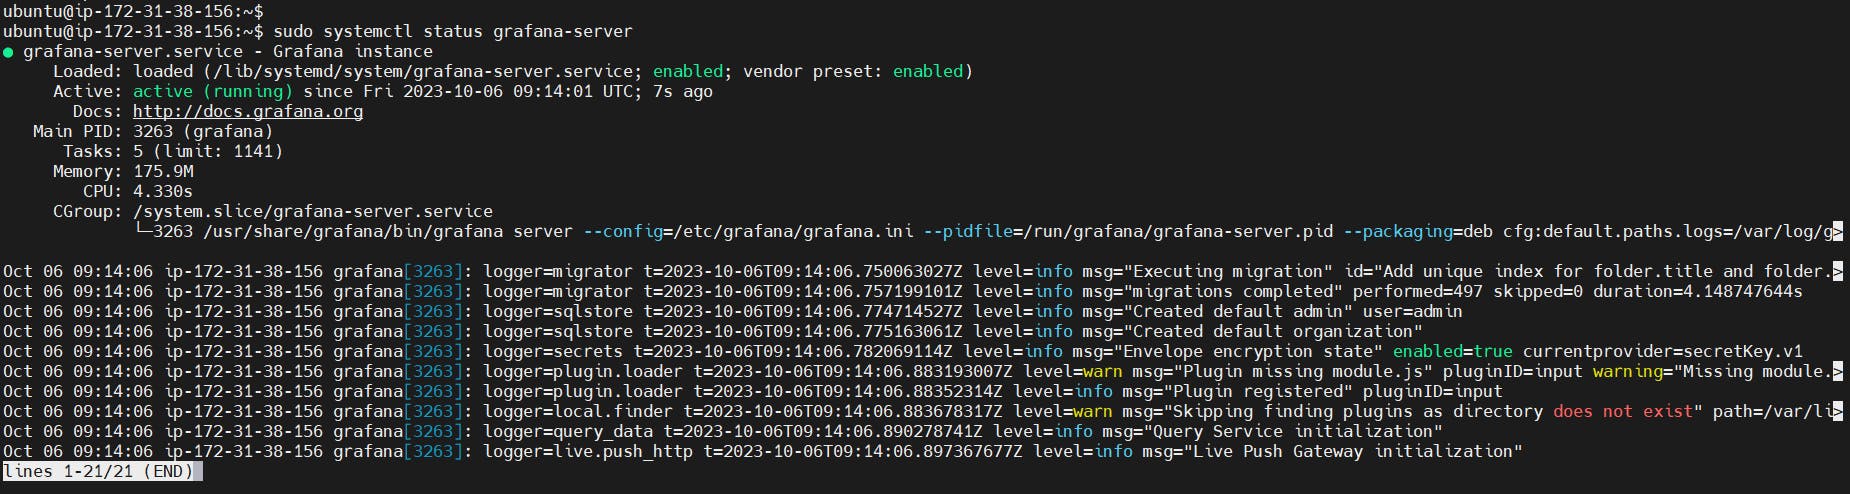
To check the status of Grafana, run the following command:
sudo systemctl status grafana-server
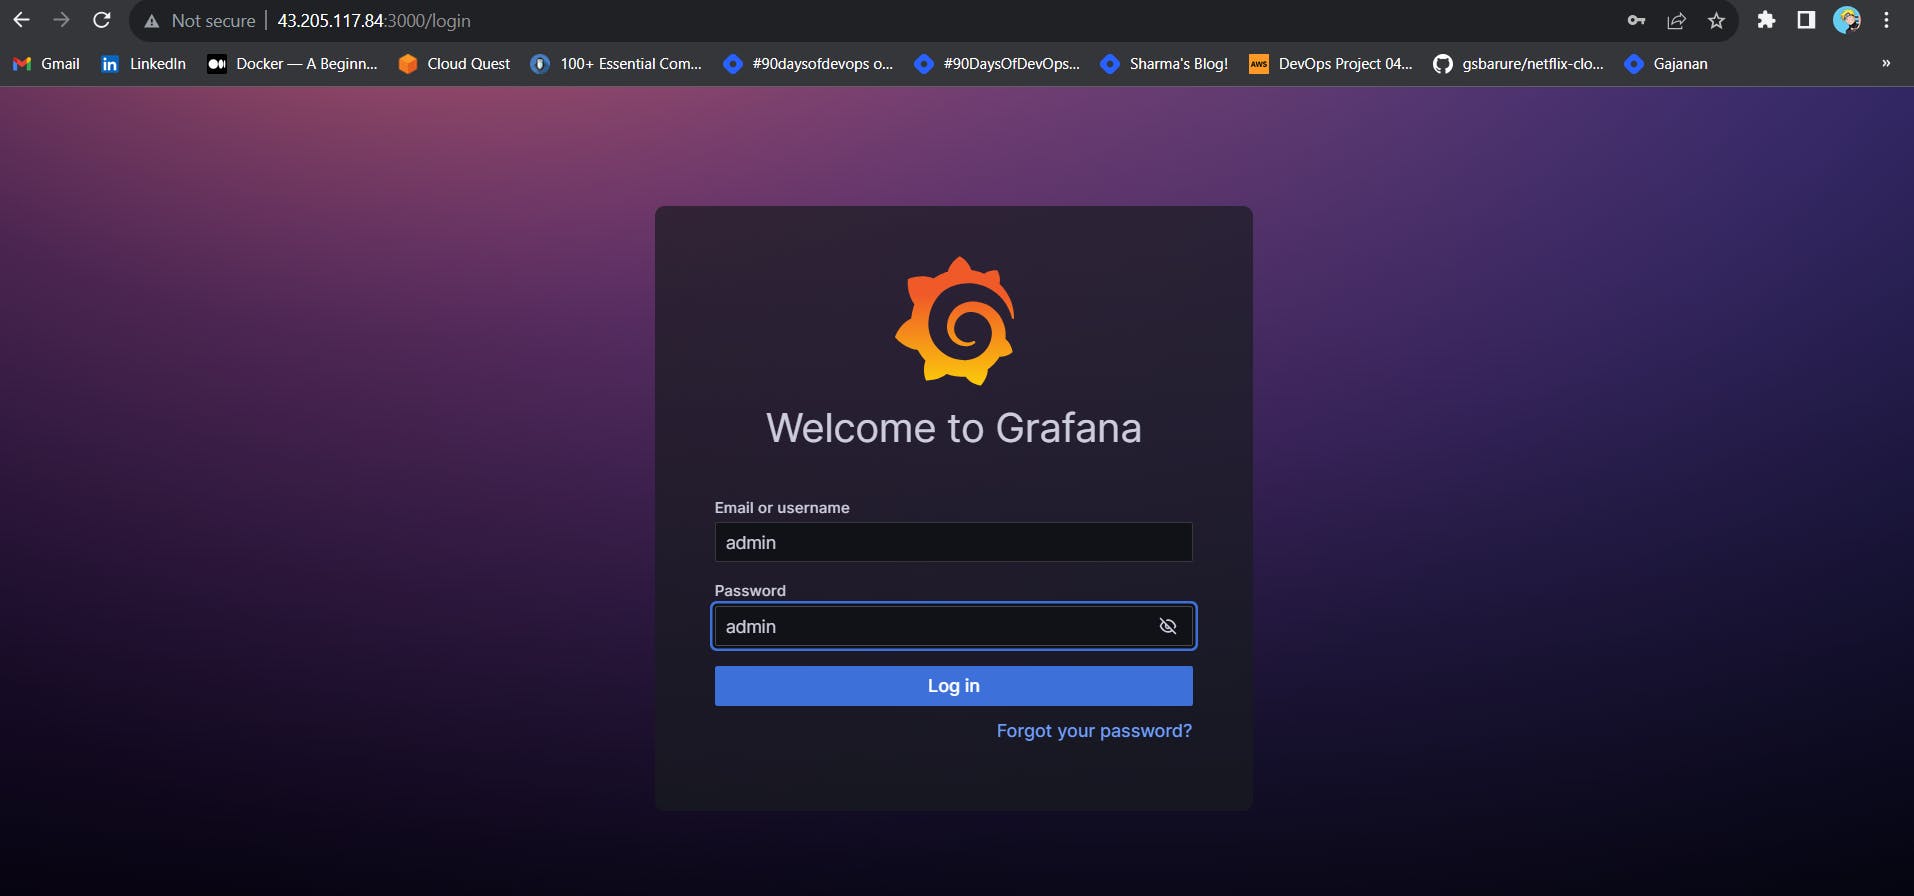
Go to http://<ip>:3000 and log in to the Grafana using default credentials. The username is admin, and the password is admin as well.
username admin
password admin
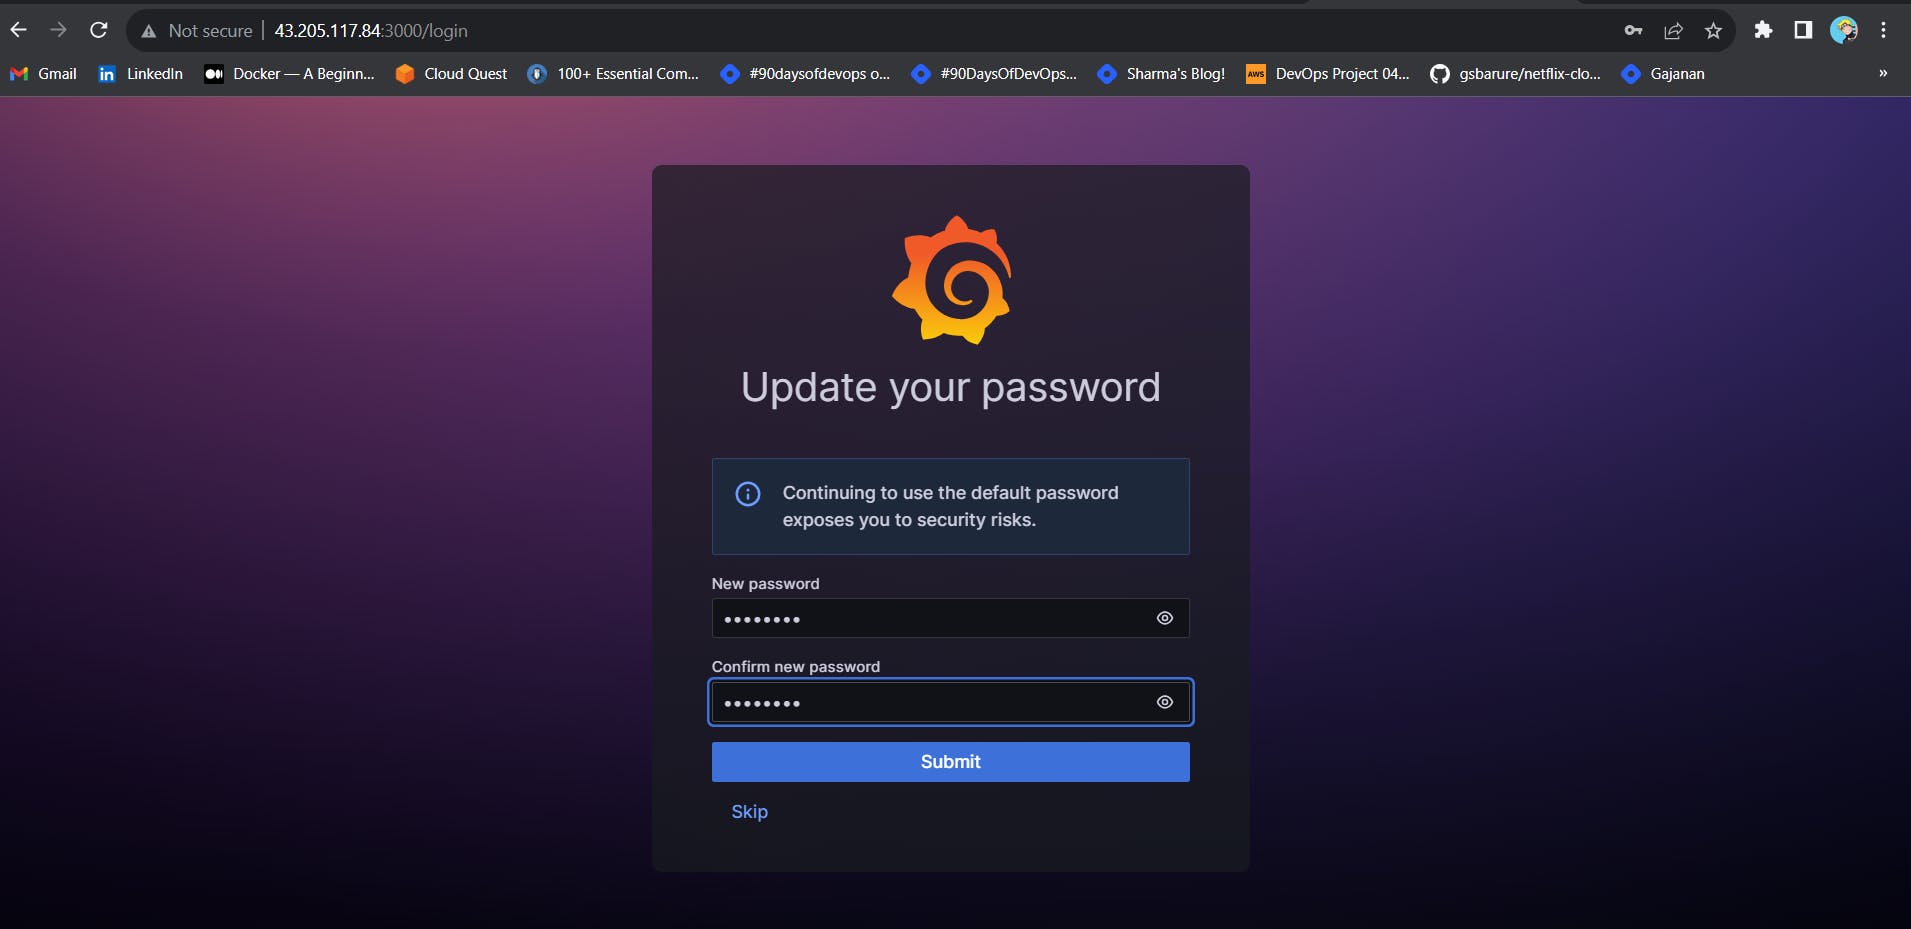
When you log in for the first time, you get the option to change the password.
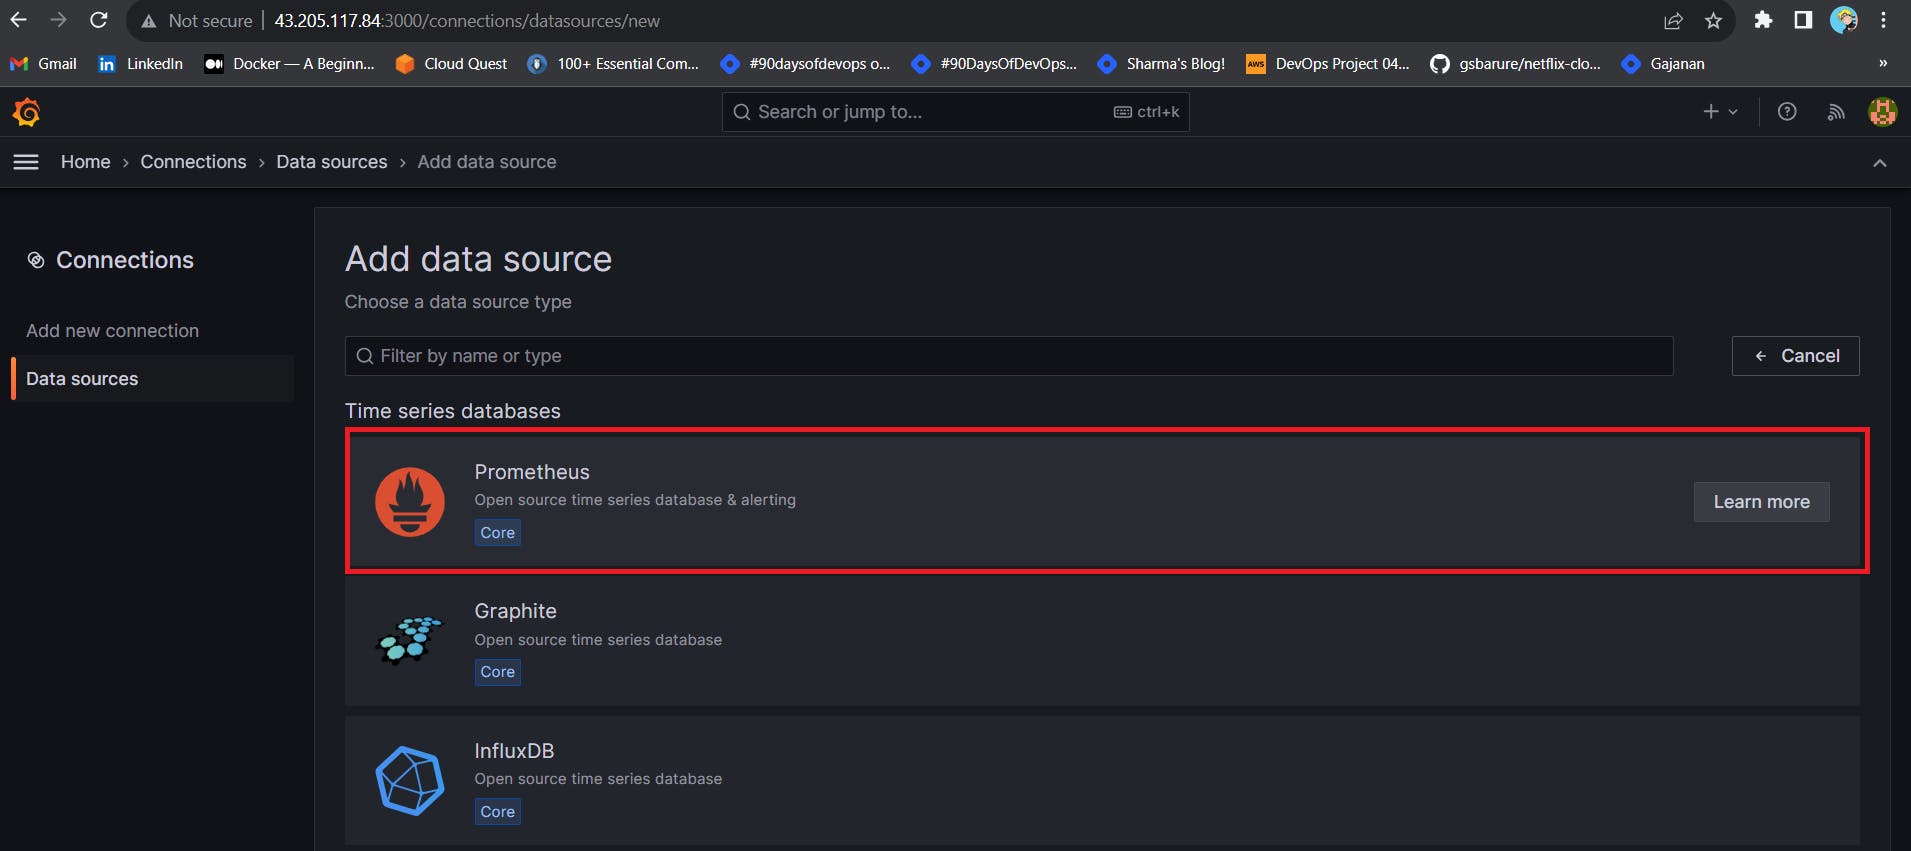
To visualize metrics, you need to add a data source first.
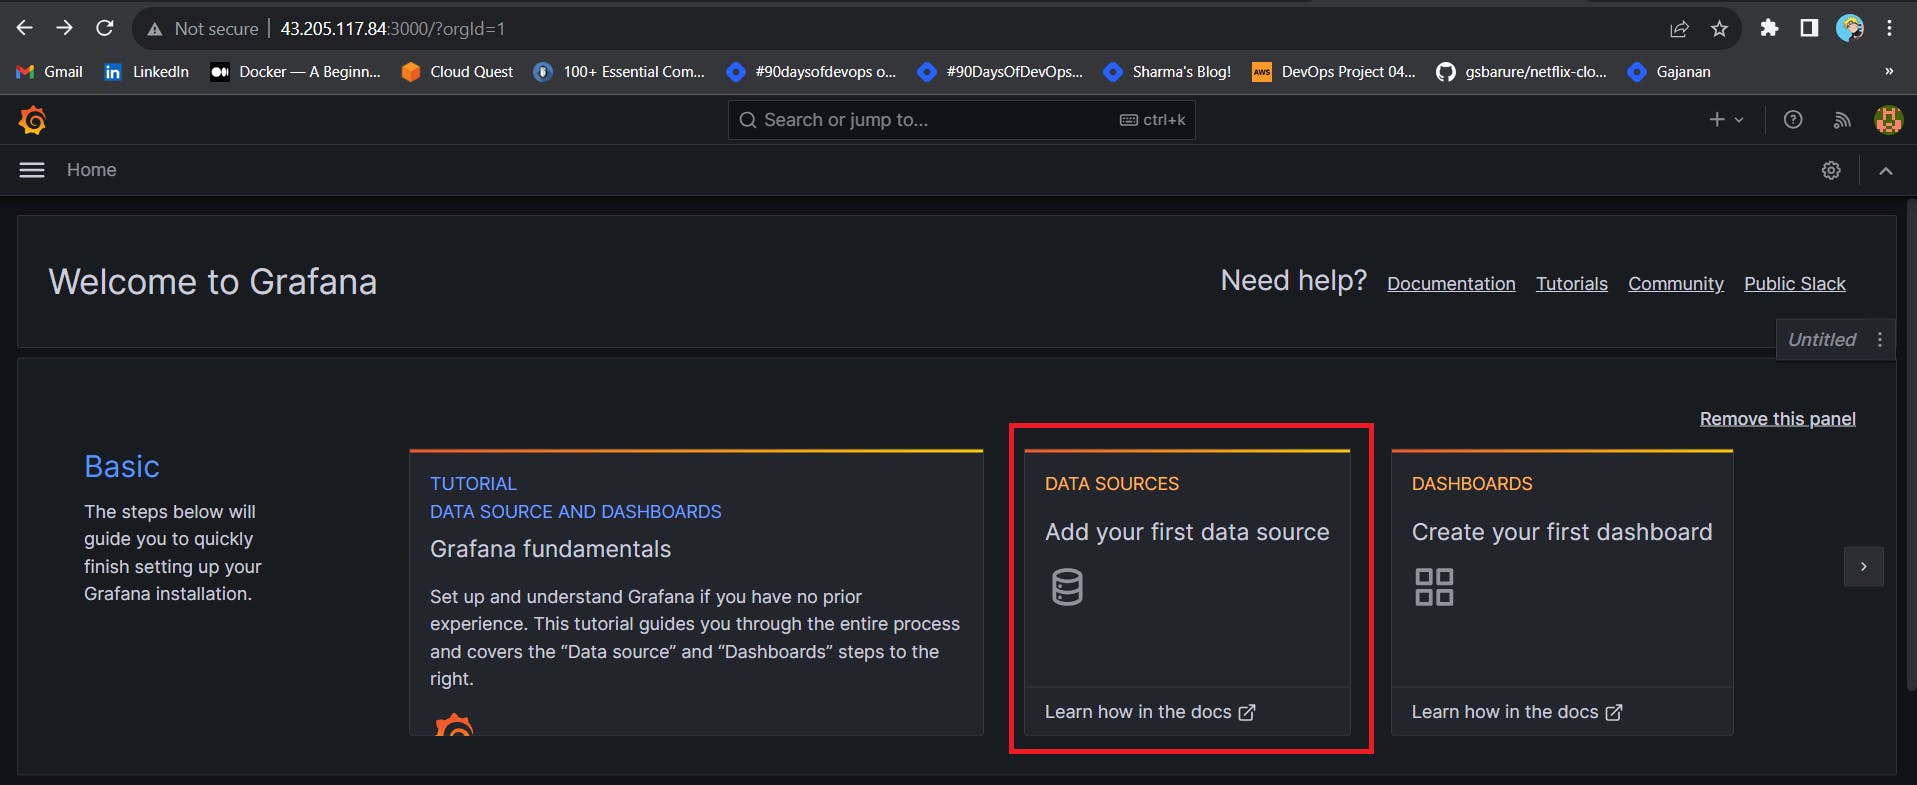
Click Add data source and select Prometheus.
For the URL, enter localhost:9090 and click Save and test. You can see Data source is working.
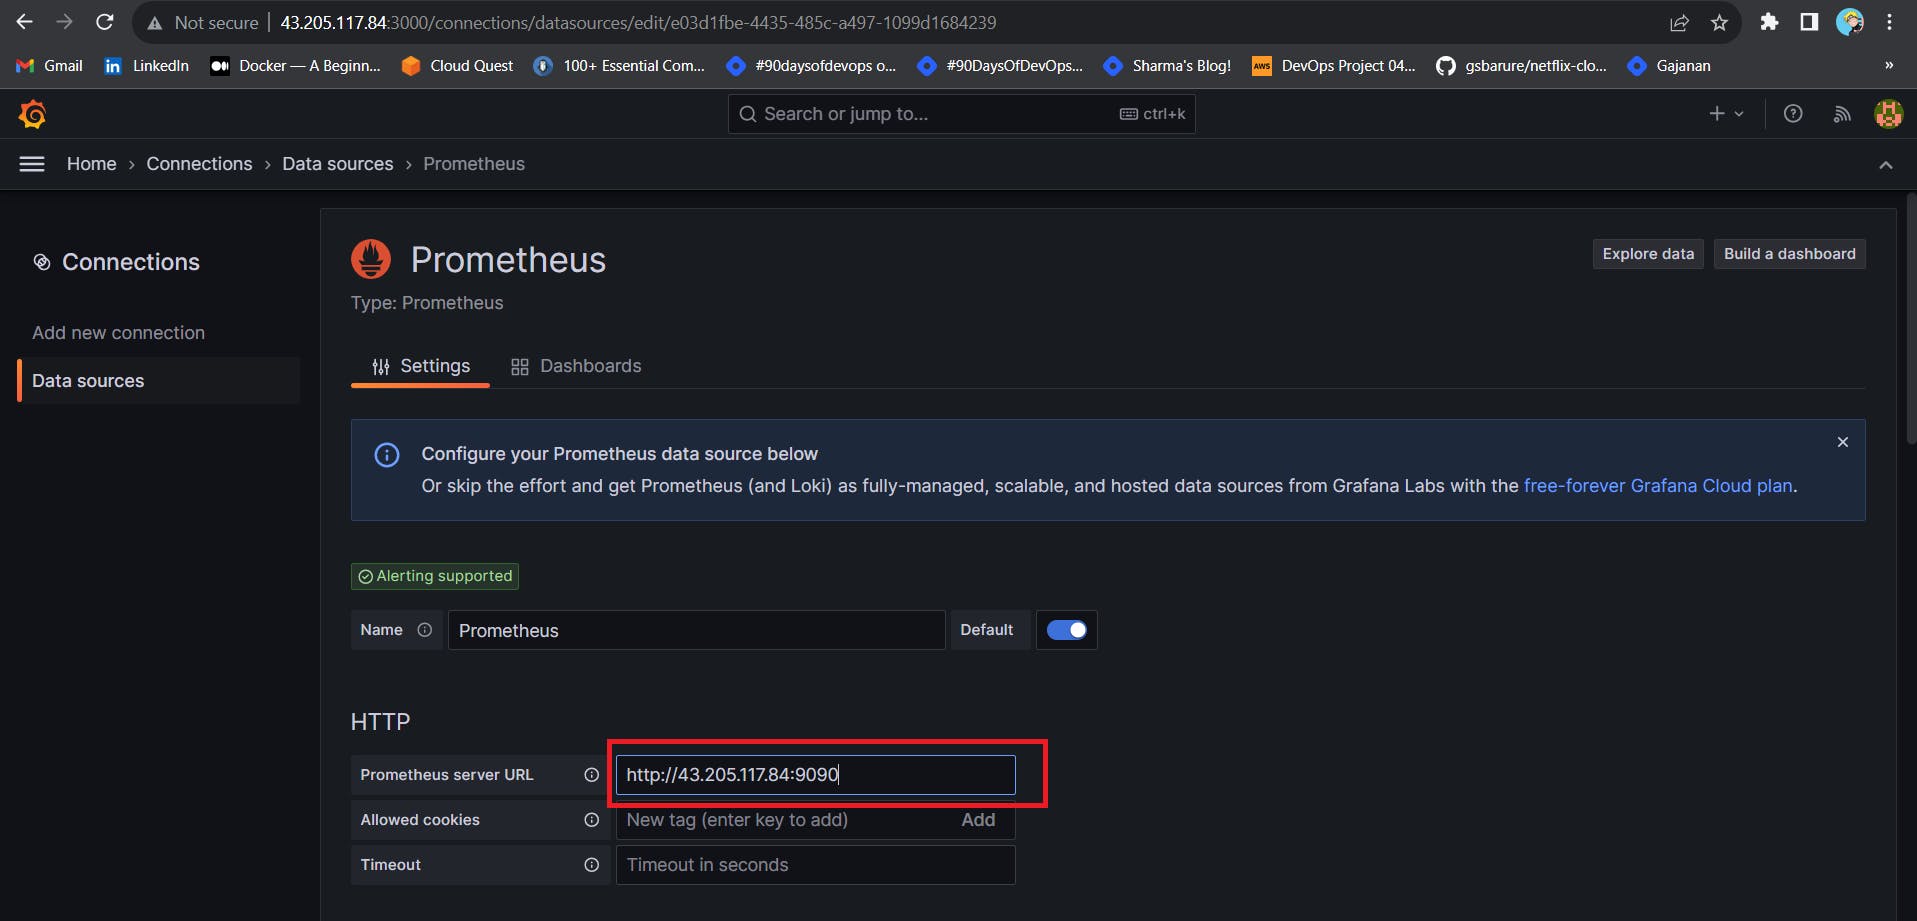
Click on Save and Test.

Let’s add Dashboard for a better view
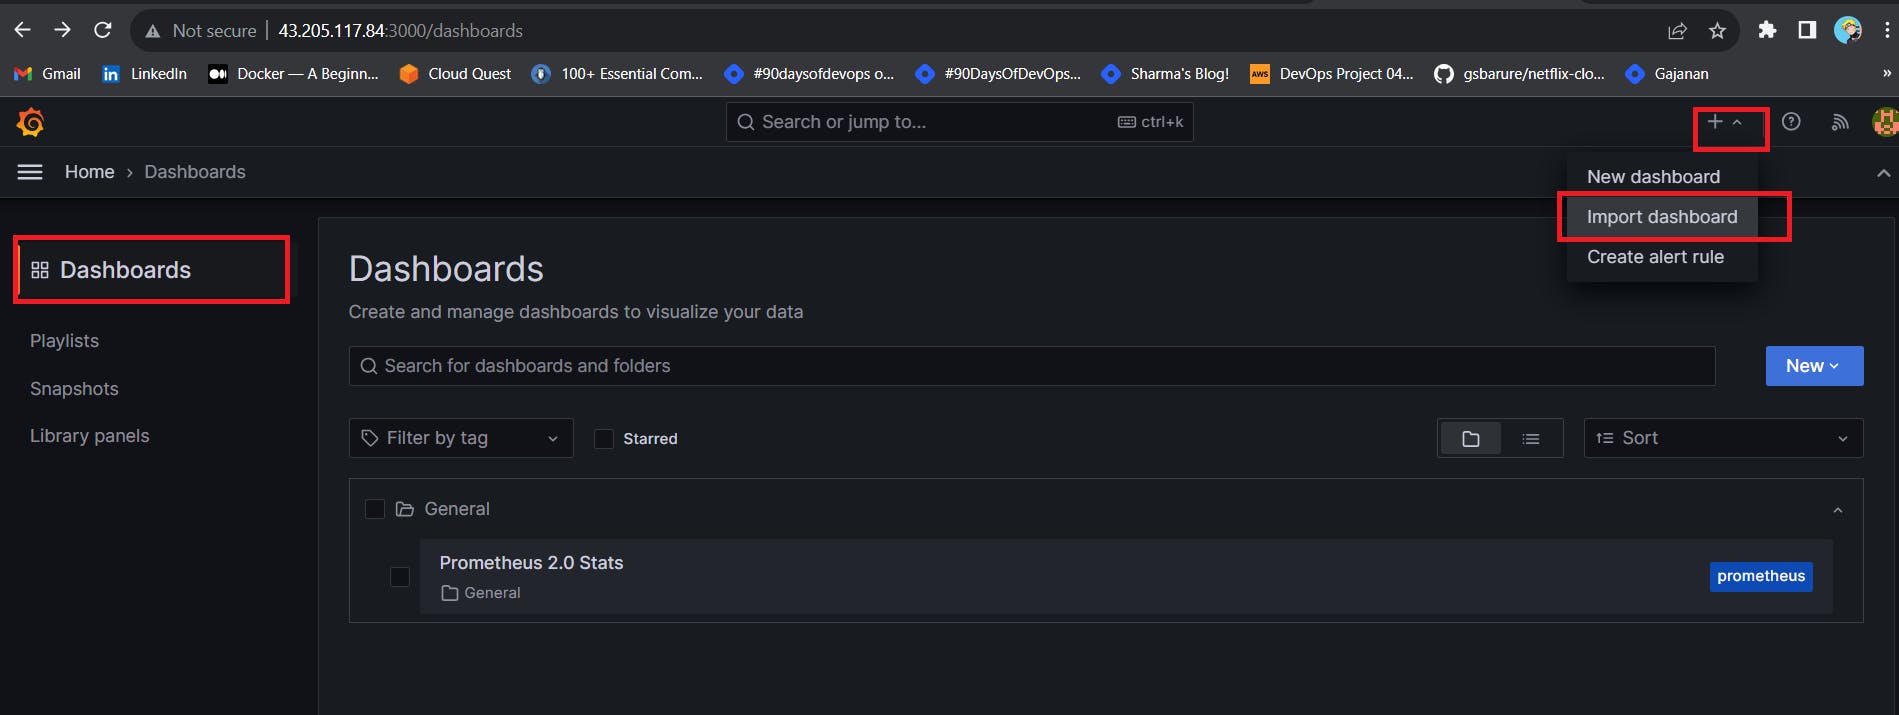
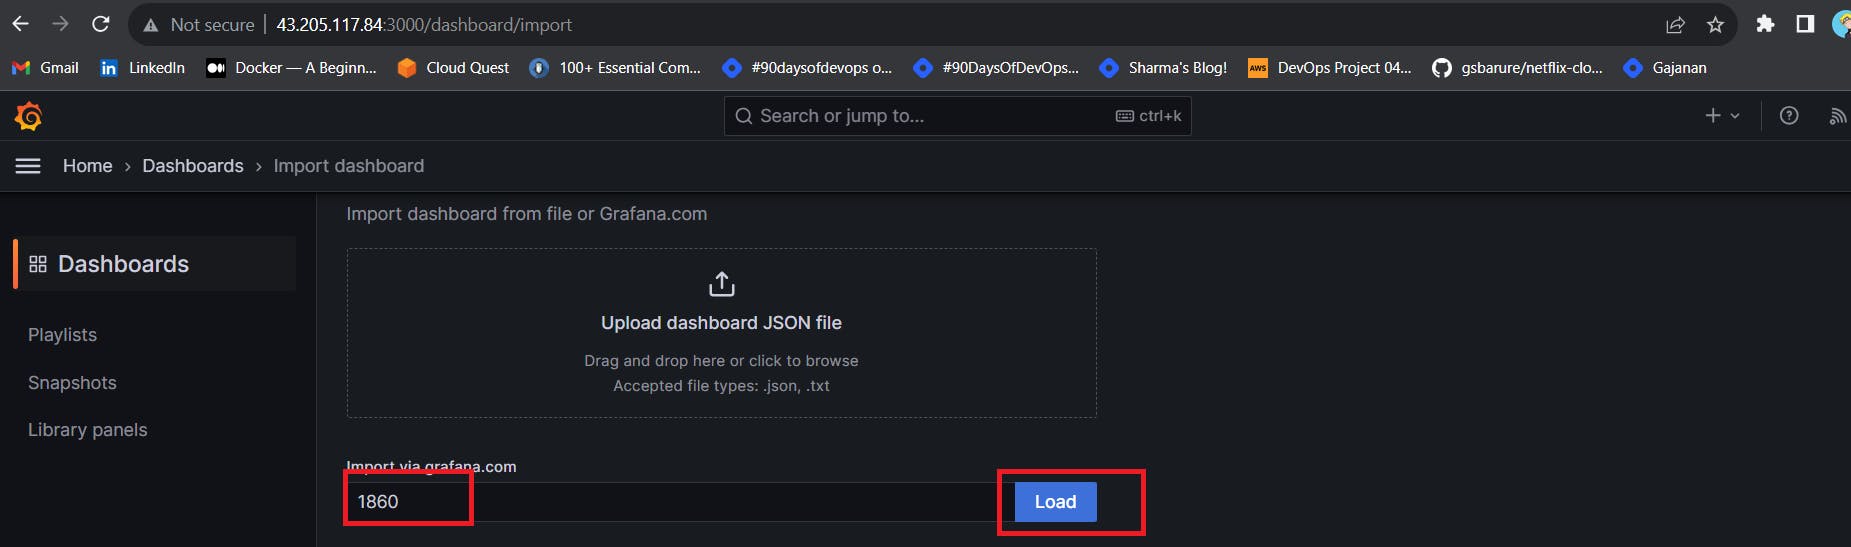
Click on Import Dashboard paste this code 1860 and click on load
Select the Datasource and click on Import
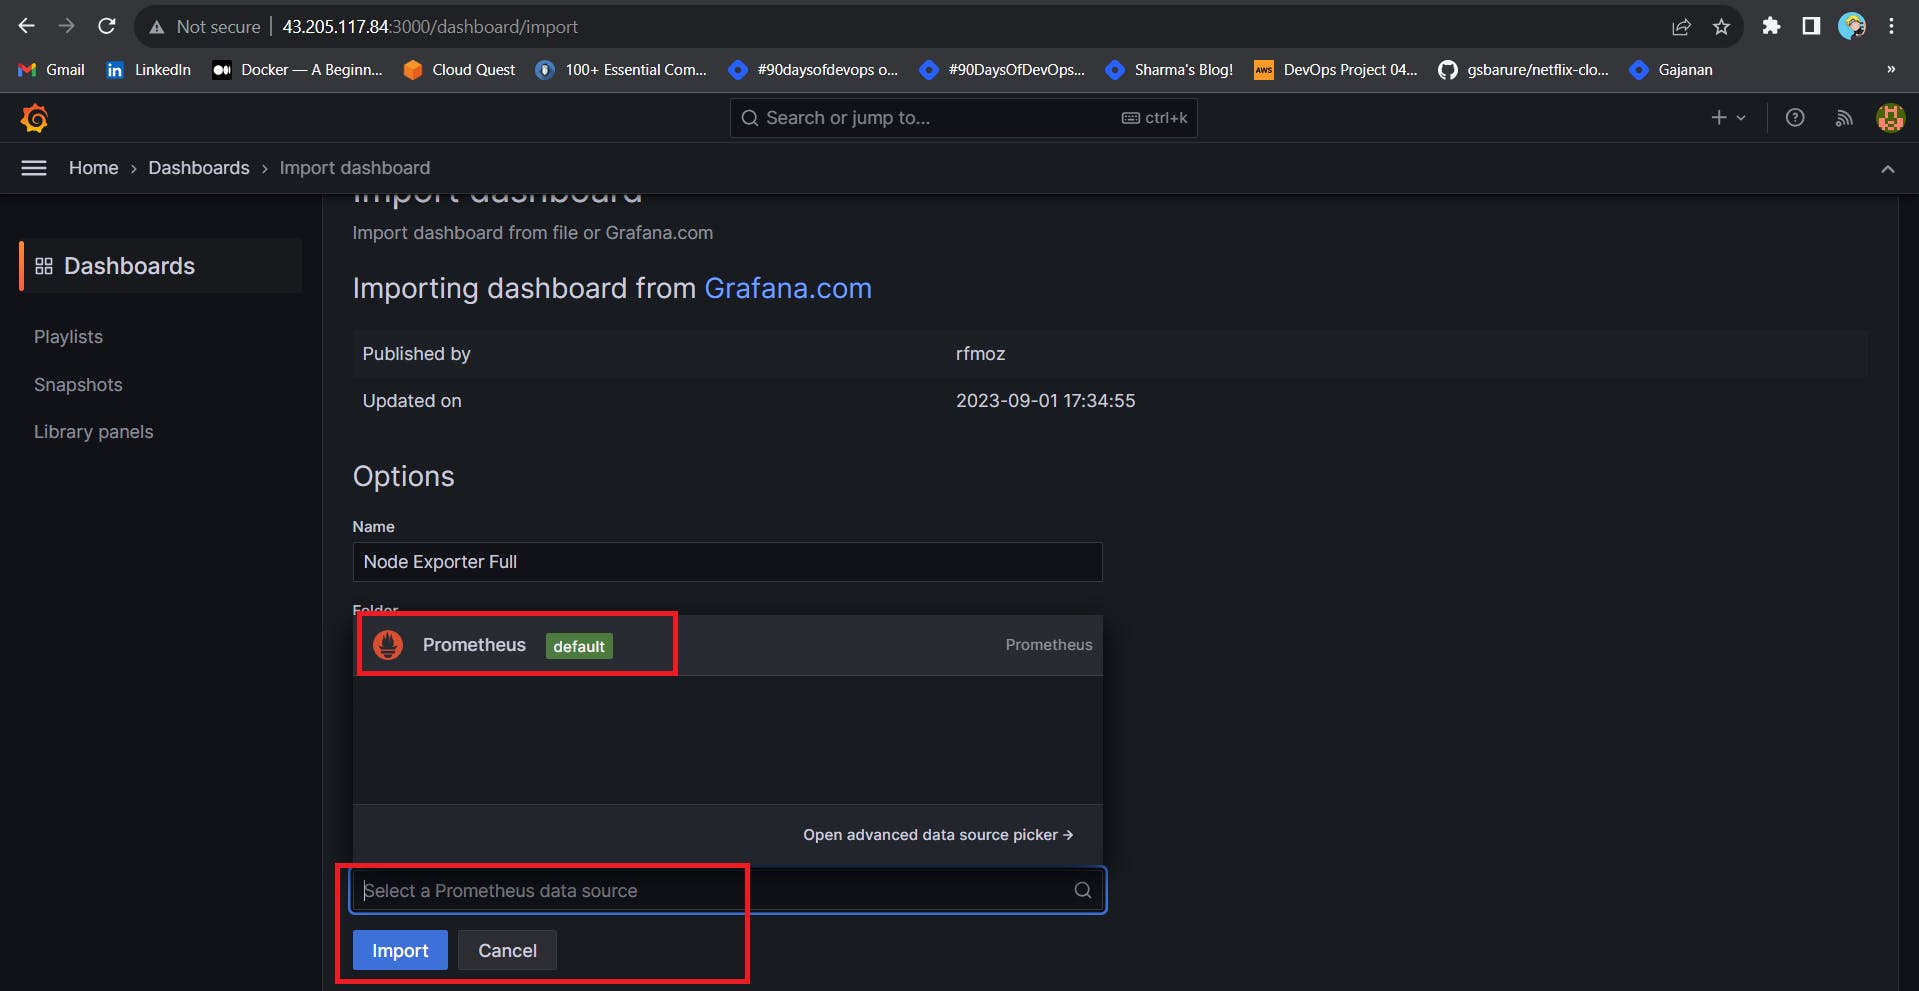
You will see this output
Step 5 - Install the Prometheus Plugin and Integrate it with the Prometheus server
Let’s Monitor JENKINS SYSTEM
Need Jenkins up and running machine
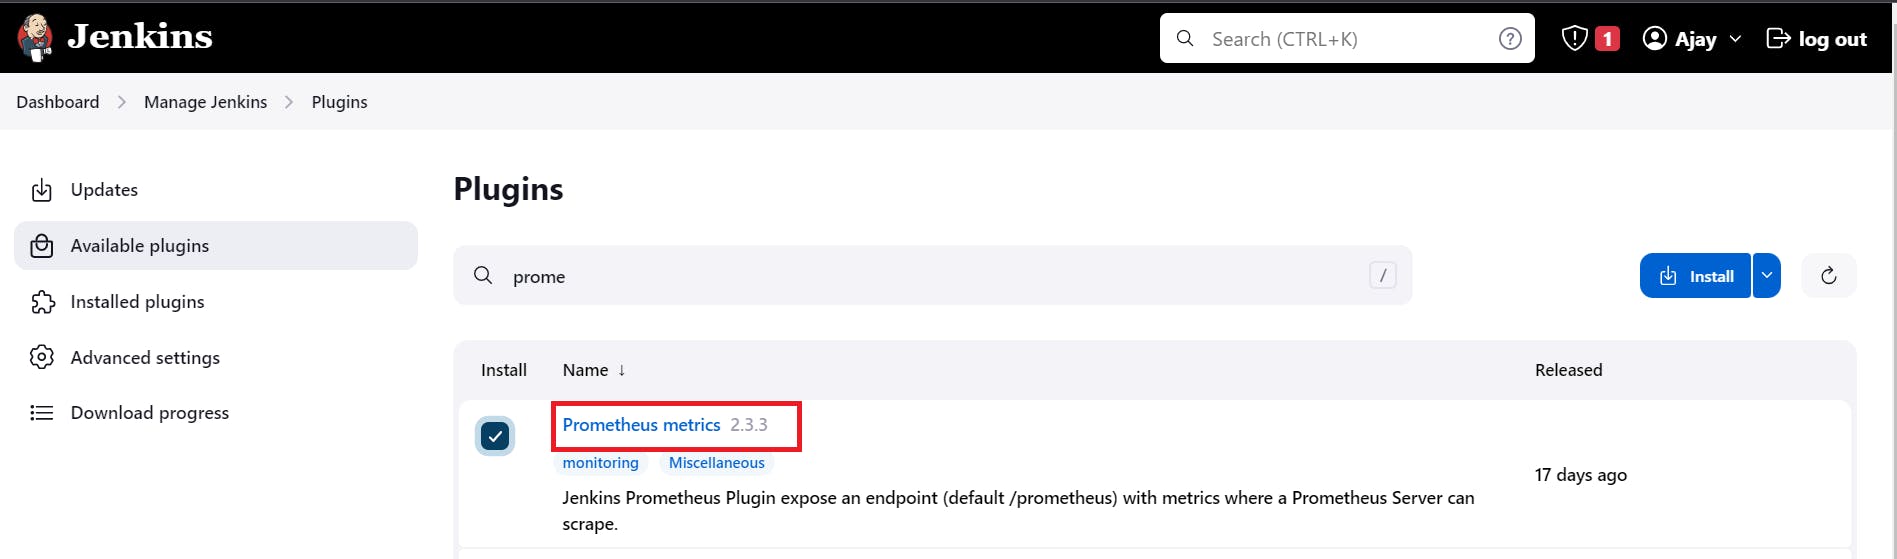
Goto Manage Jenkins --> Plugins --> Available Plugins
Search for Prometheus and install it
Once that is done you will Prometheus is set to /Prometheus path in system configurations
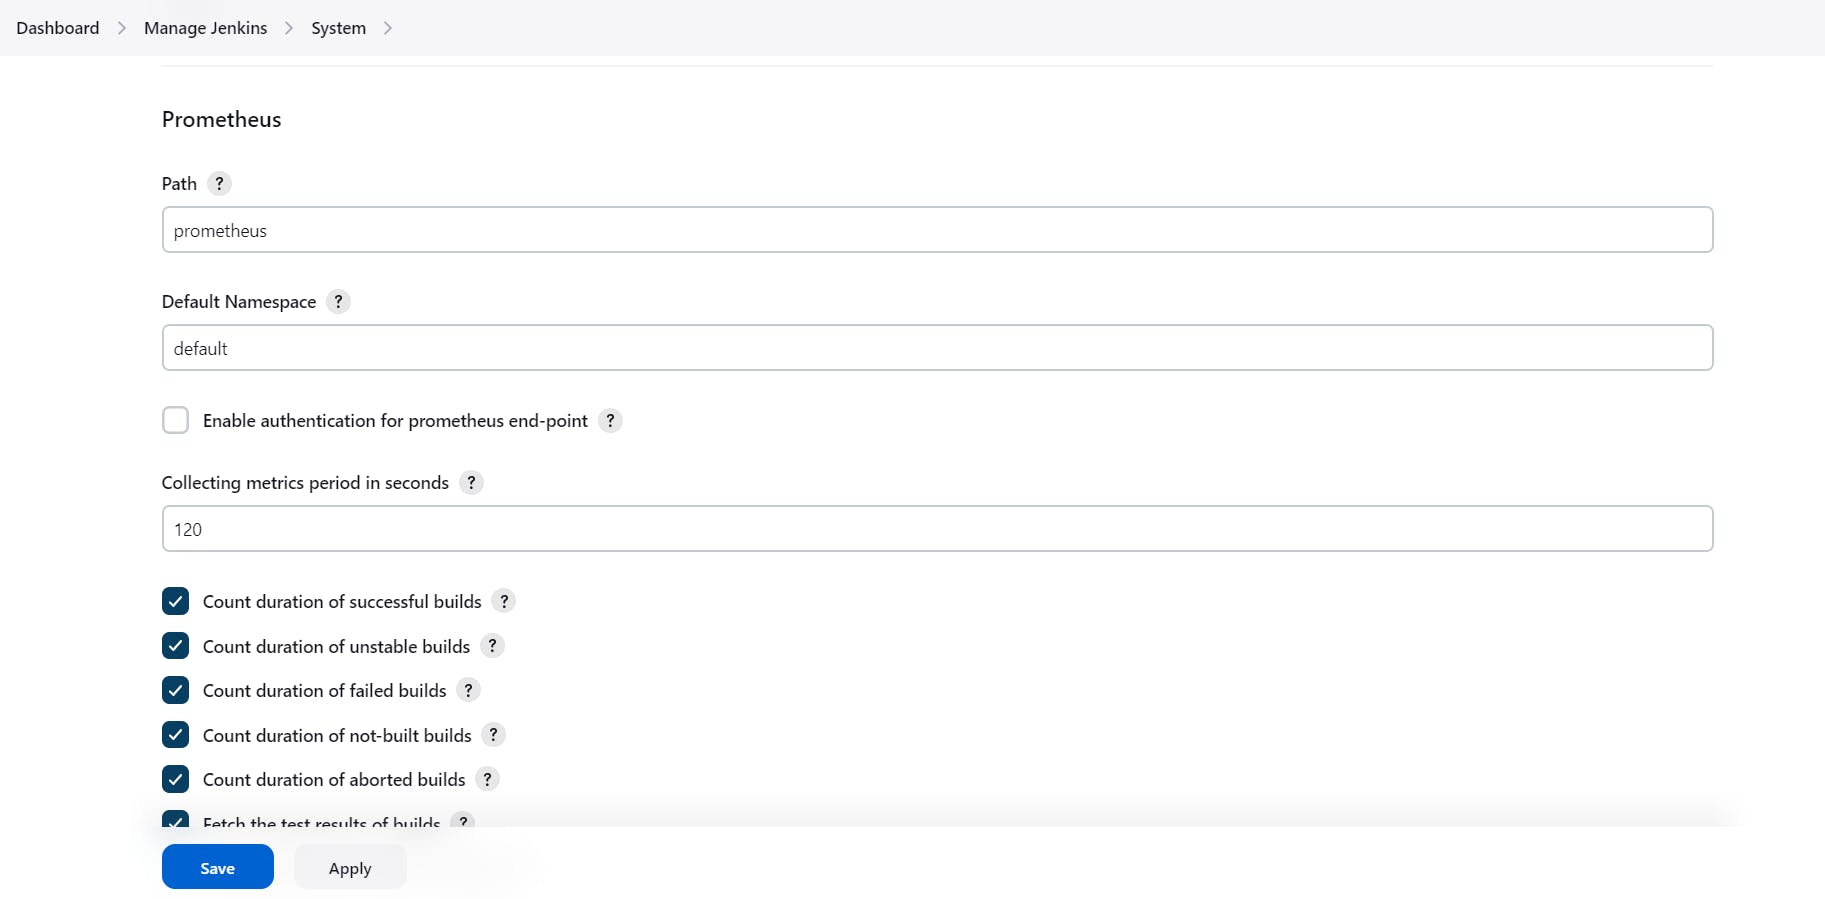
Nothing to change click on apply and save
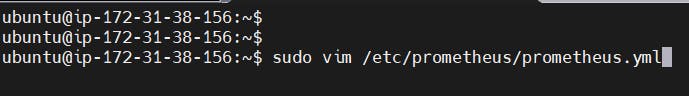
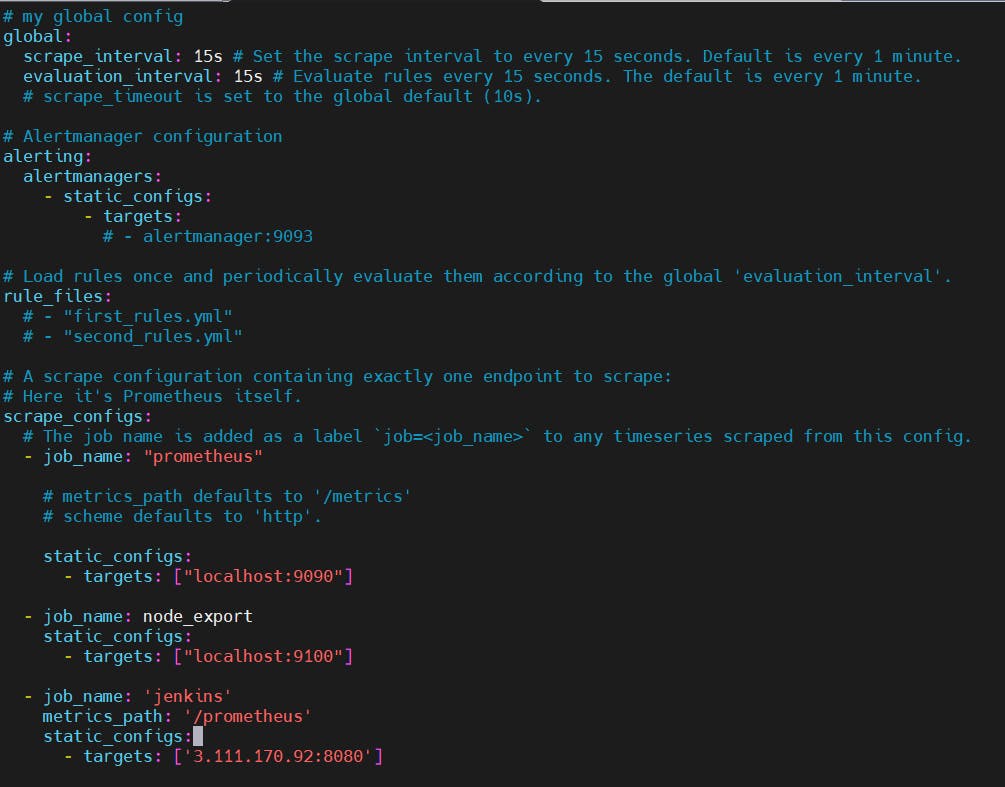
To create a static target, you need to add job_name with static_configs. go to Prometheus server
sudo vim /etc/prometheus/prometheus.yml
Paste below code
- job_name: 'jenkins'
    metrics_path: '/prometheus'
    static_configs:
      - targets: [':8080']
Before, restarting check if the config is valid.
promtool check config /etc/prometheus/prometheus.yml
Then, you can use a POST request to reload the config.
curl -X POST http://localhost:9090/-/reload
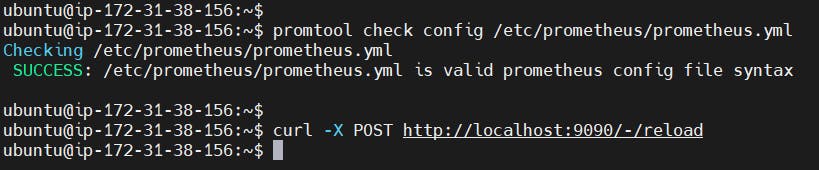
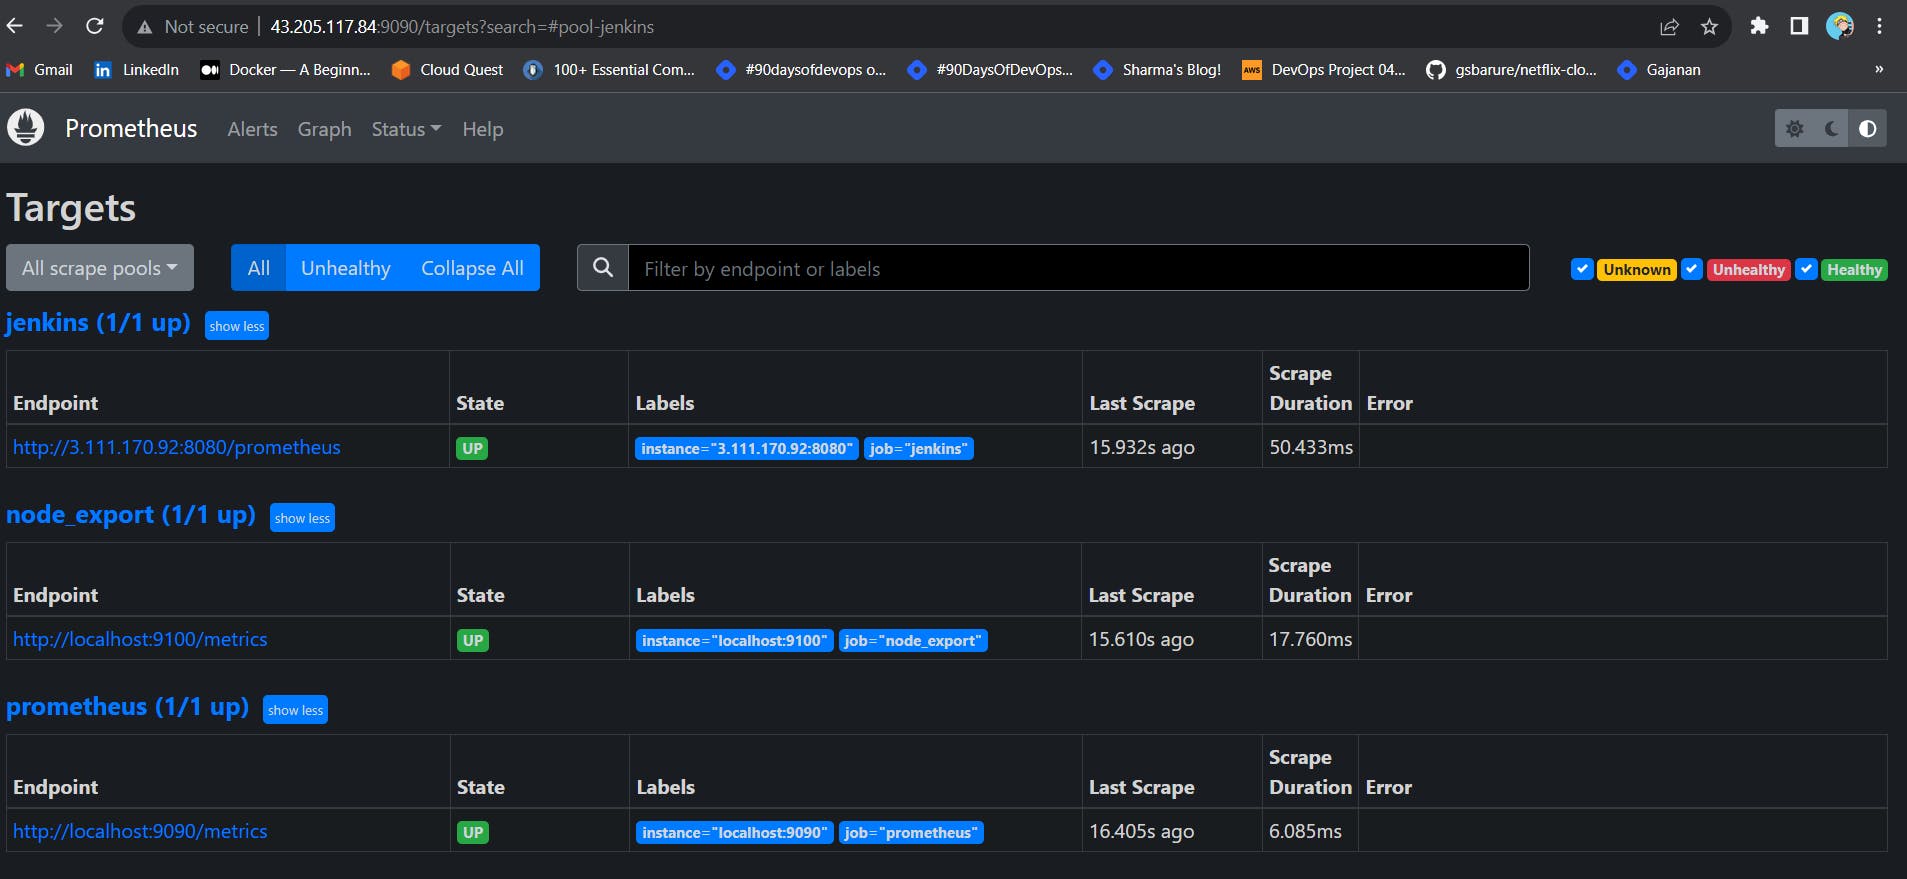
Check the targets section
http://:9090/targets
You will see Jenkins is added to it
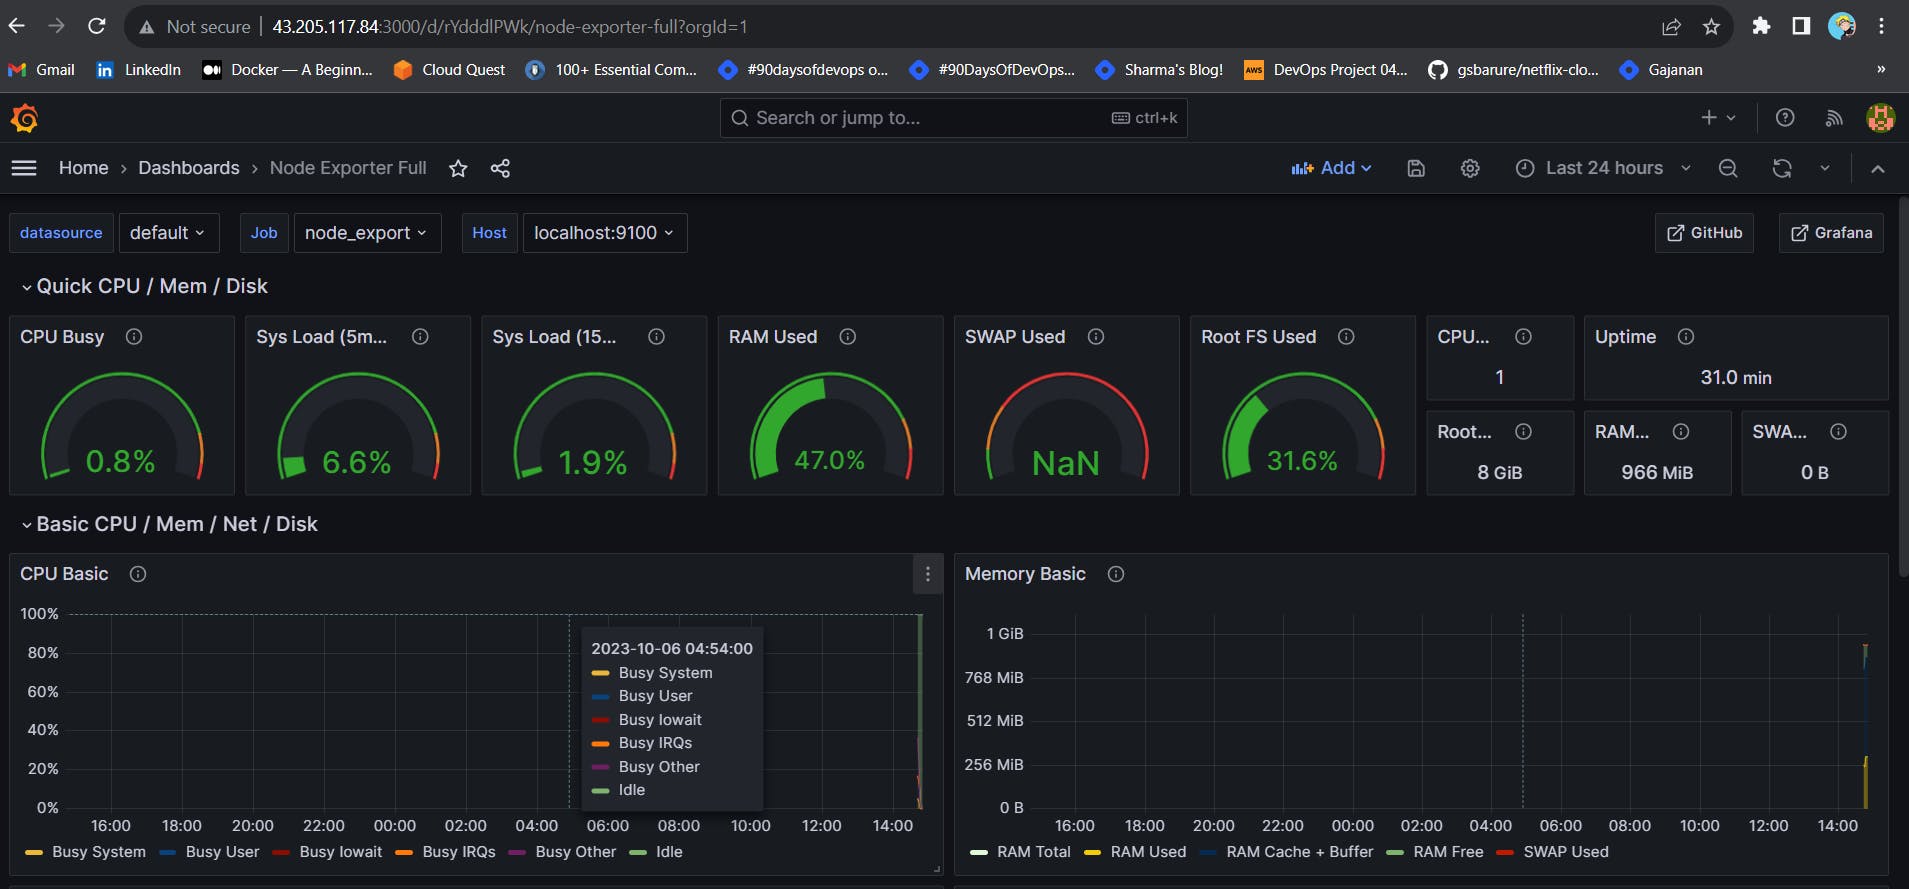
Let’s add Dashboard for a better view in Grafana
Click On Dashboard --> + symbol --> Import Dashboard
Use Id 9964 and click on load
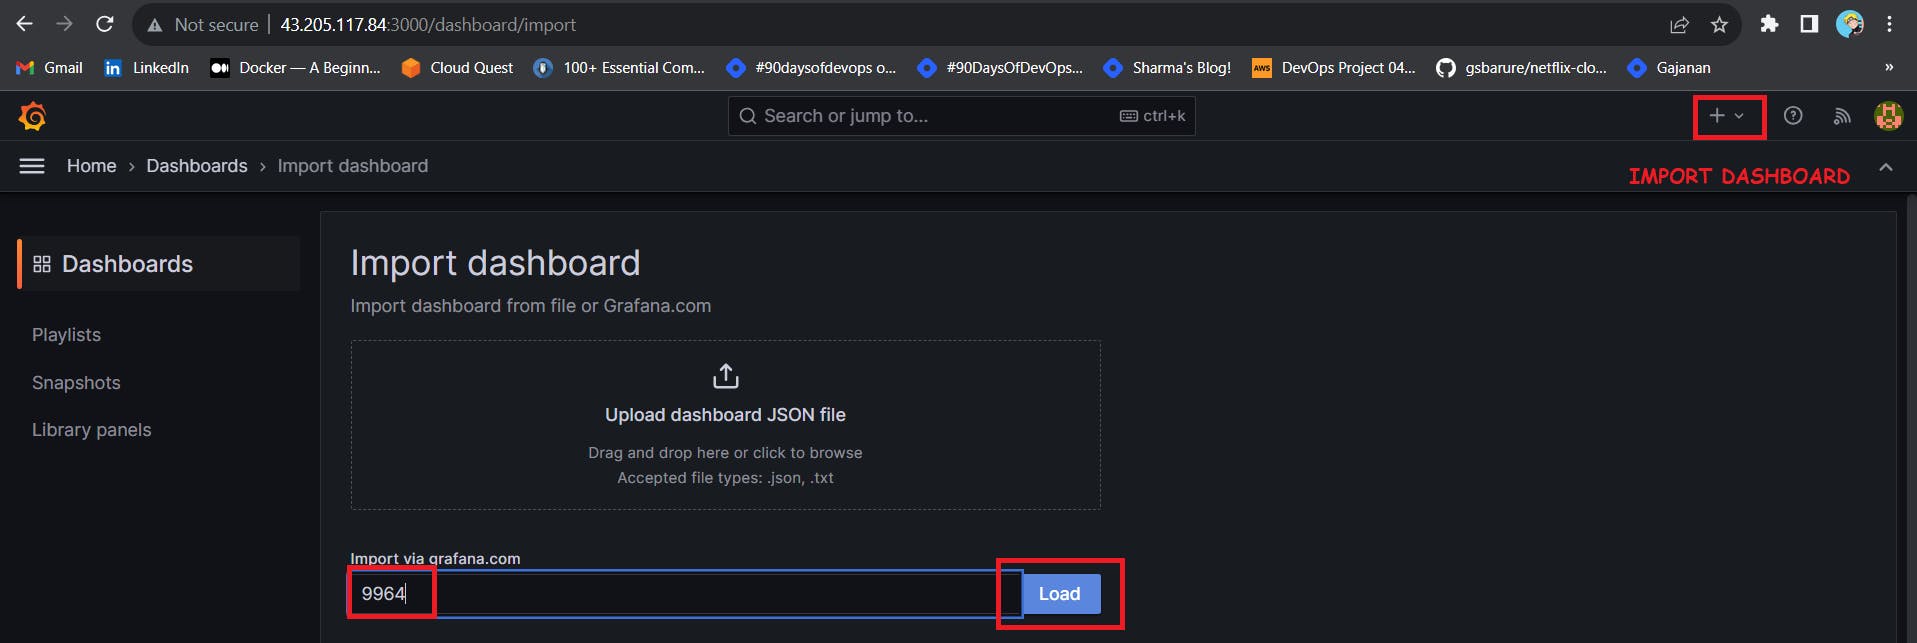
Select the data source and click on Import
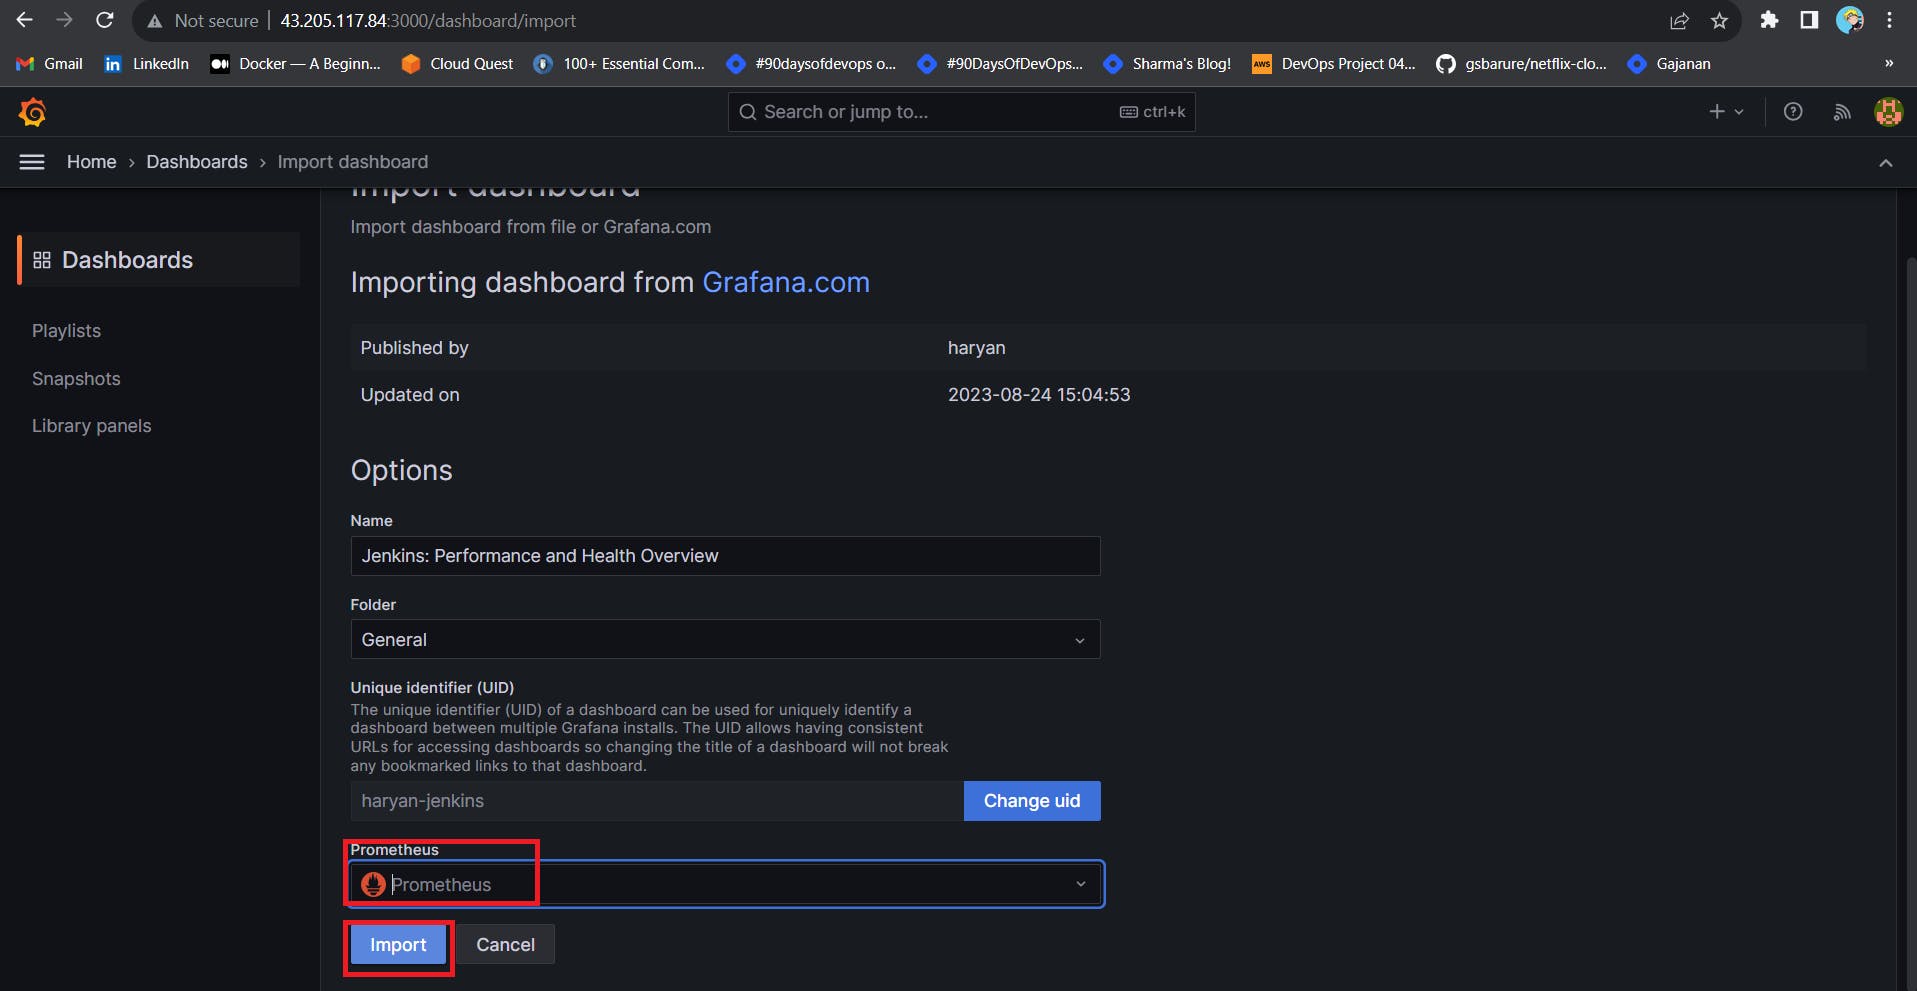
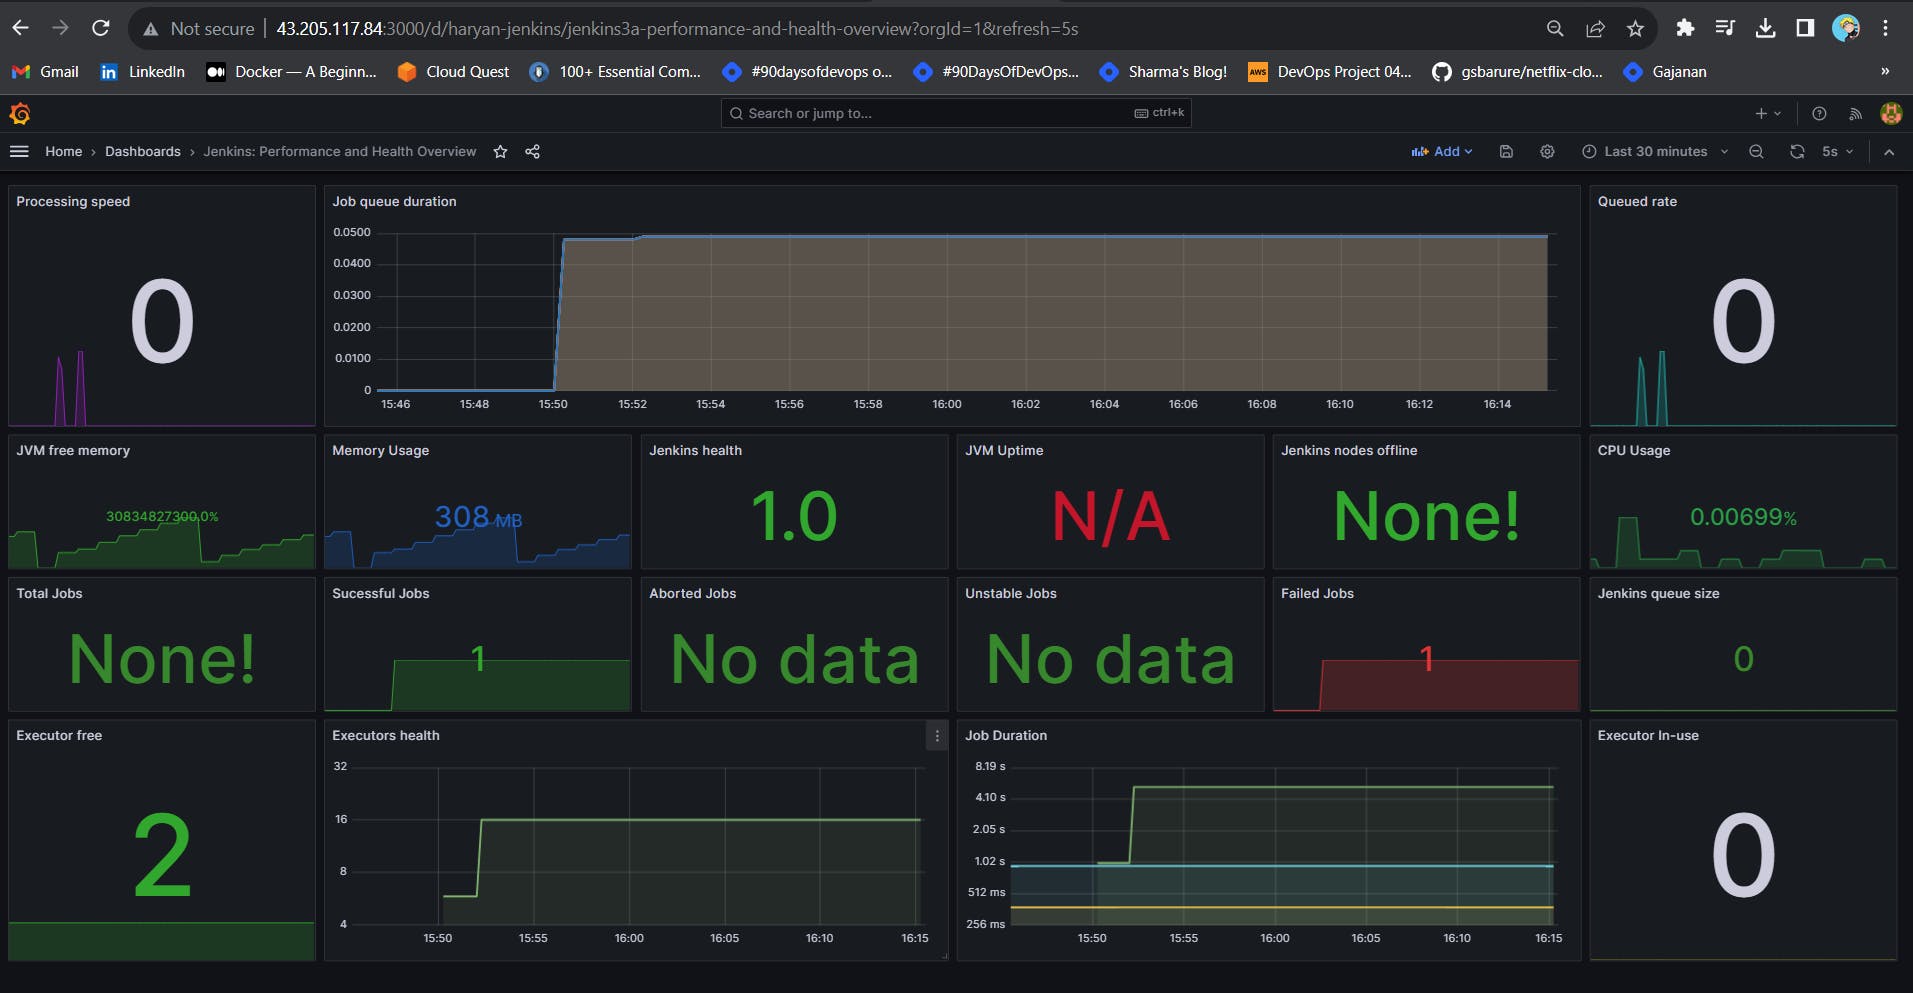
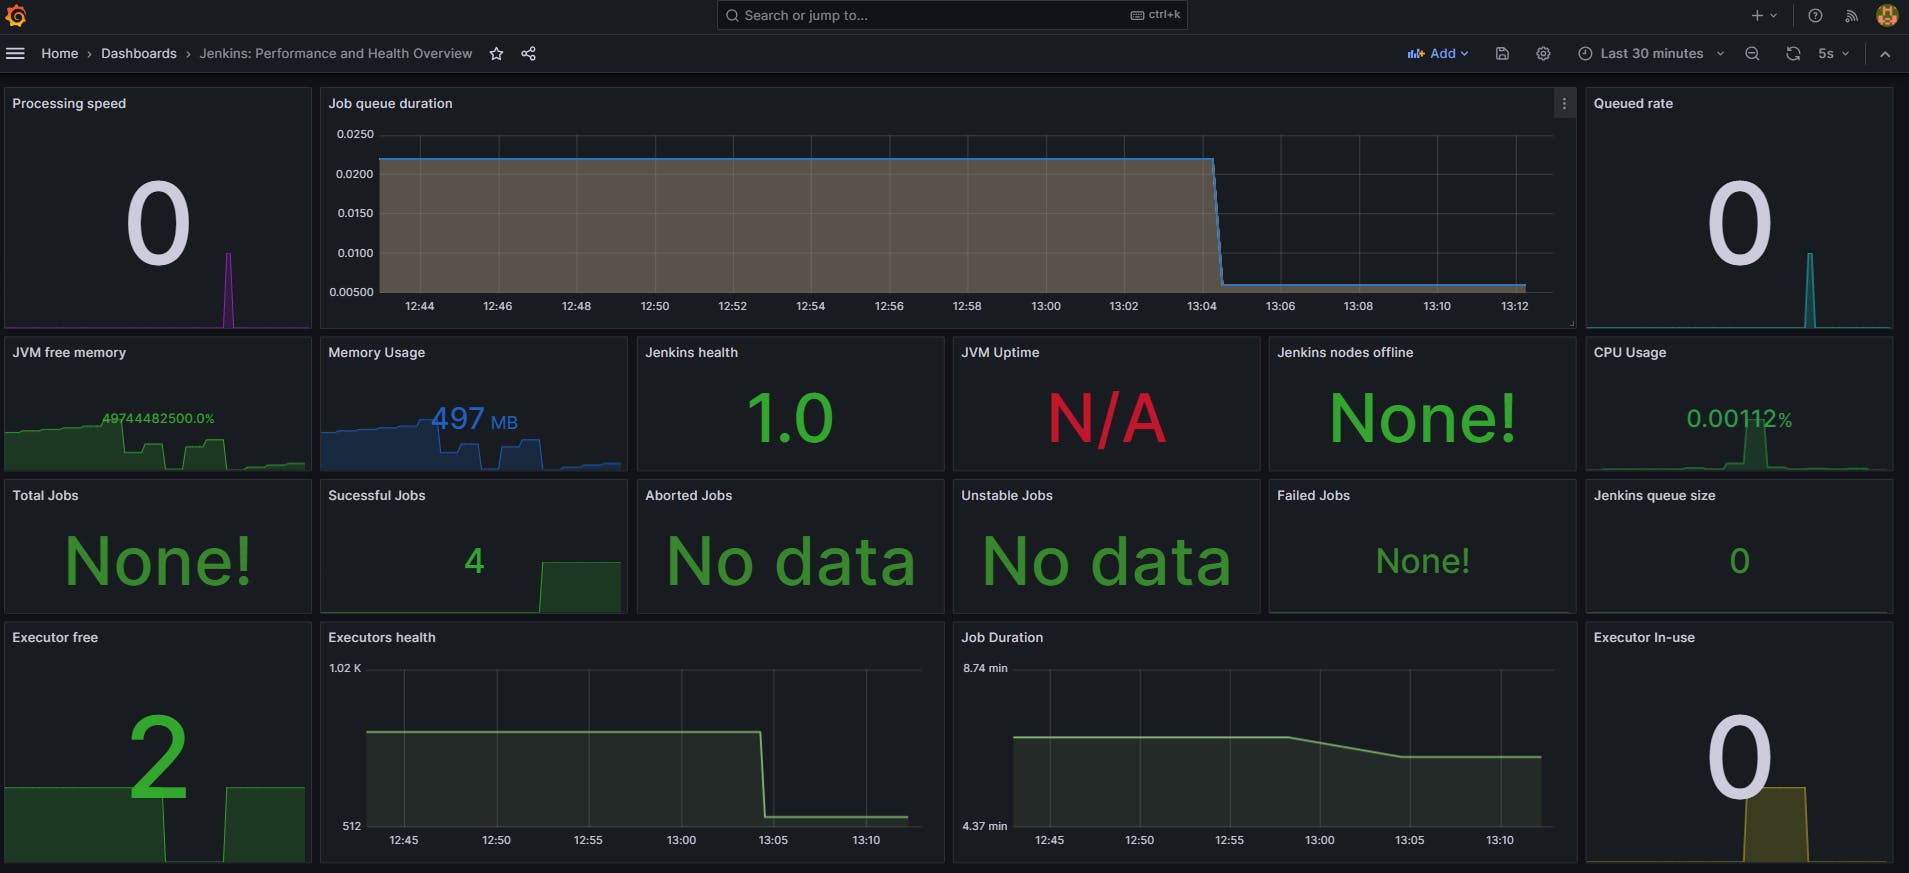
Now you will see the Detailed overview of Jenkins
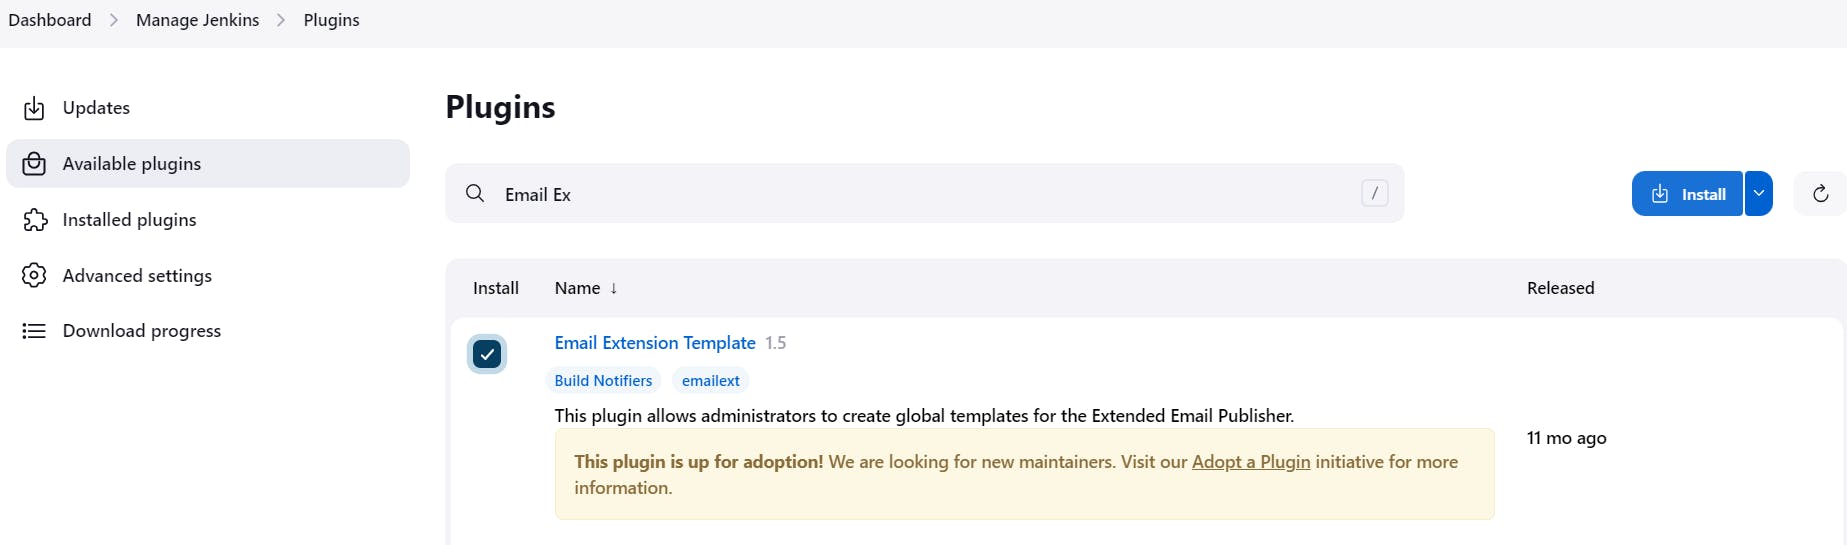
Step 6 - Email Integration With Jenkins and Plugin Setup
Install Email Extension Plugin in Jenkins
Go to your Gmail and click on your profile
Then click on Manage Your Google Account --> click on the security tab on the left side panel you will get this page(provide mail password).
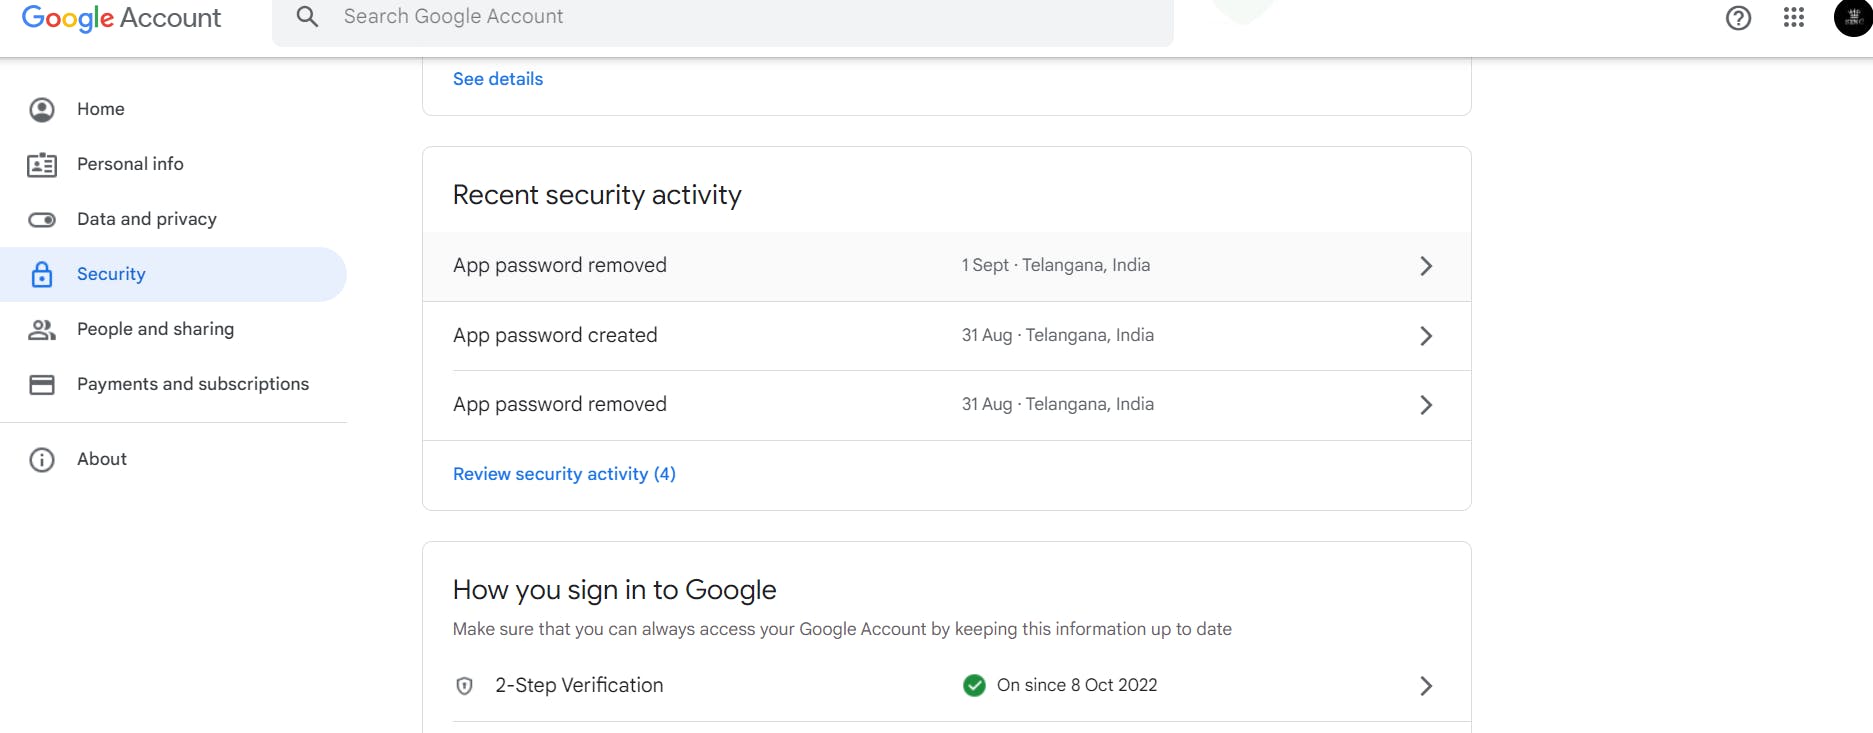
2-step verification should be enabled.
Search for the app in the search bar you will get app passwords like the below image
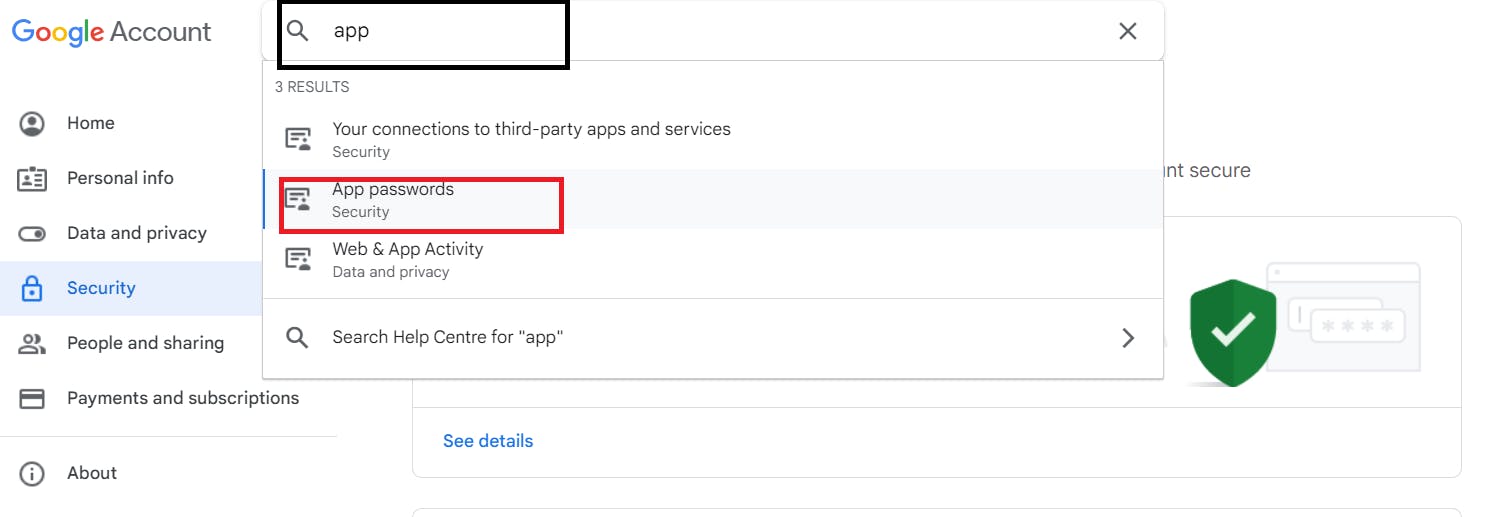
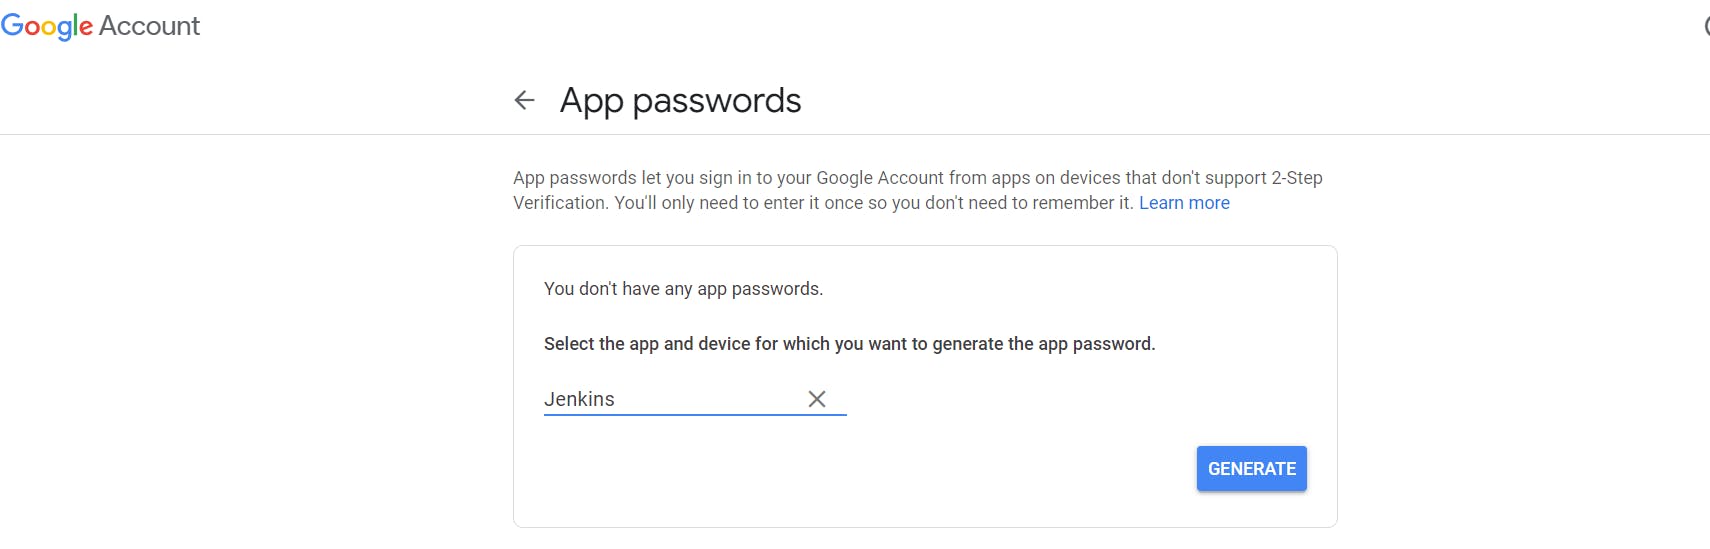
Click on other and provide your name and click on Generate and copy the password
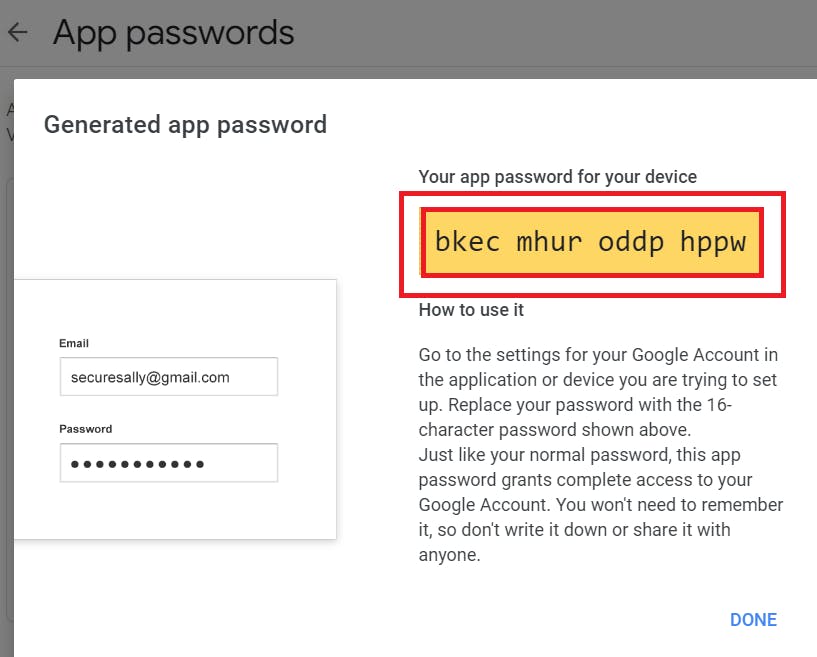
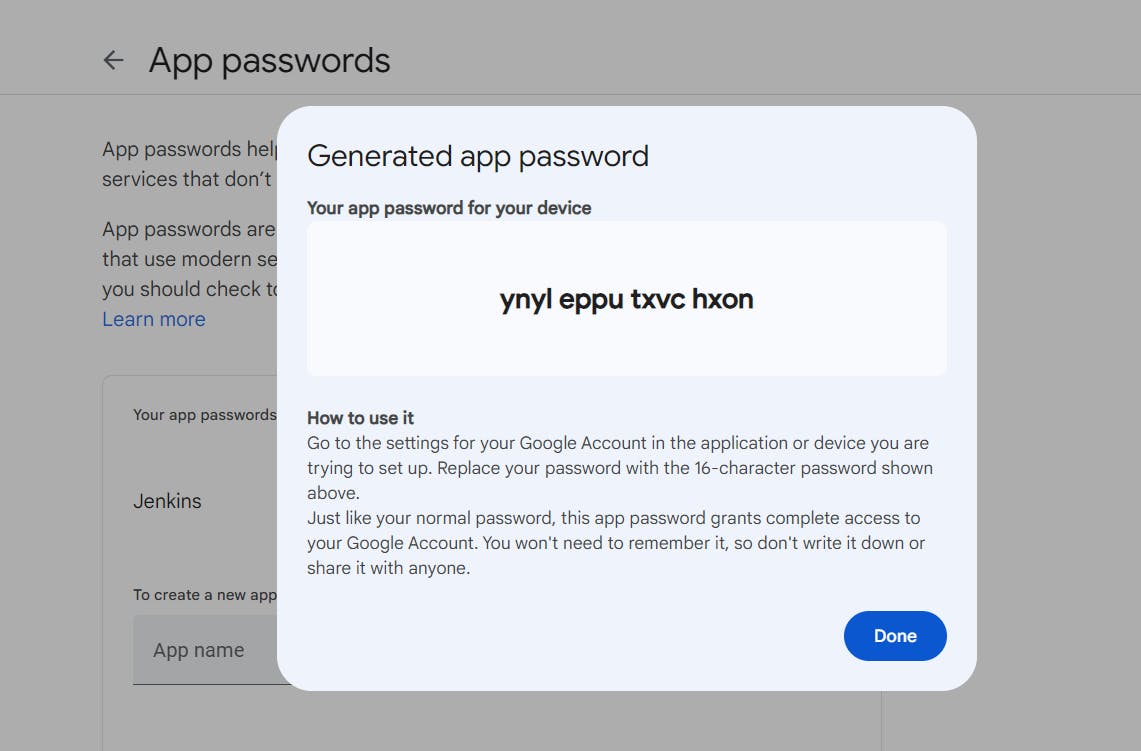
In the new update, you will get a password like this
Once the plugin is installed in Jenkins, click on manage Jenkins --> configure system there under the E-mail Notification section configure the details as shown in the below image
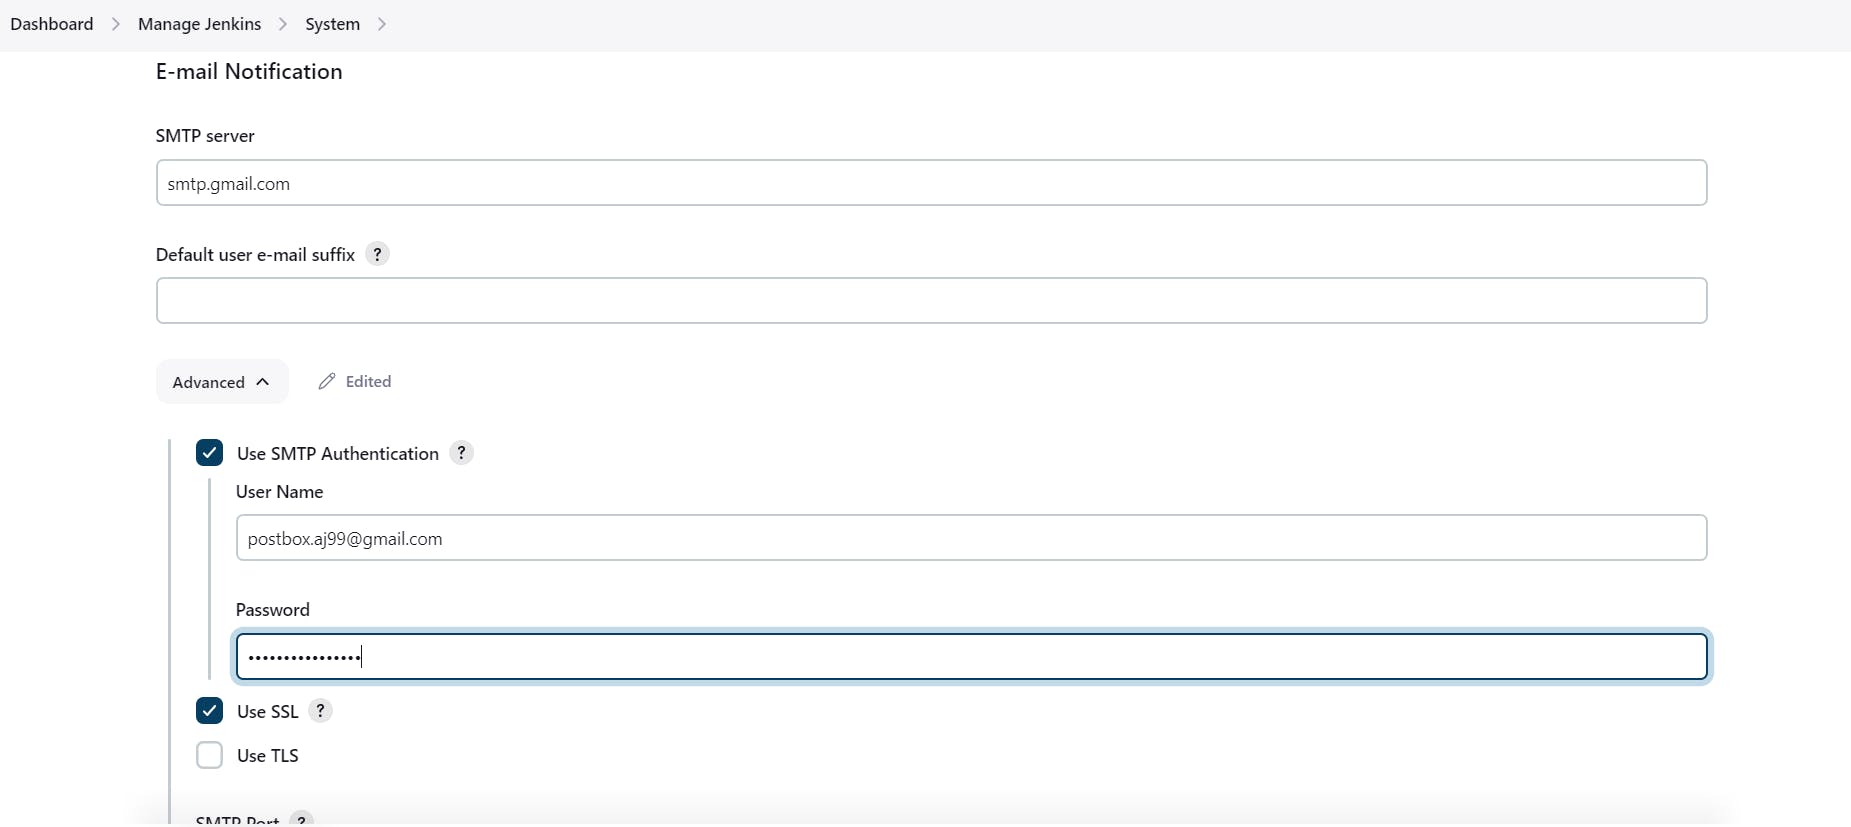
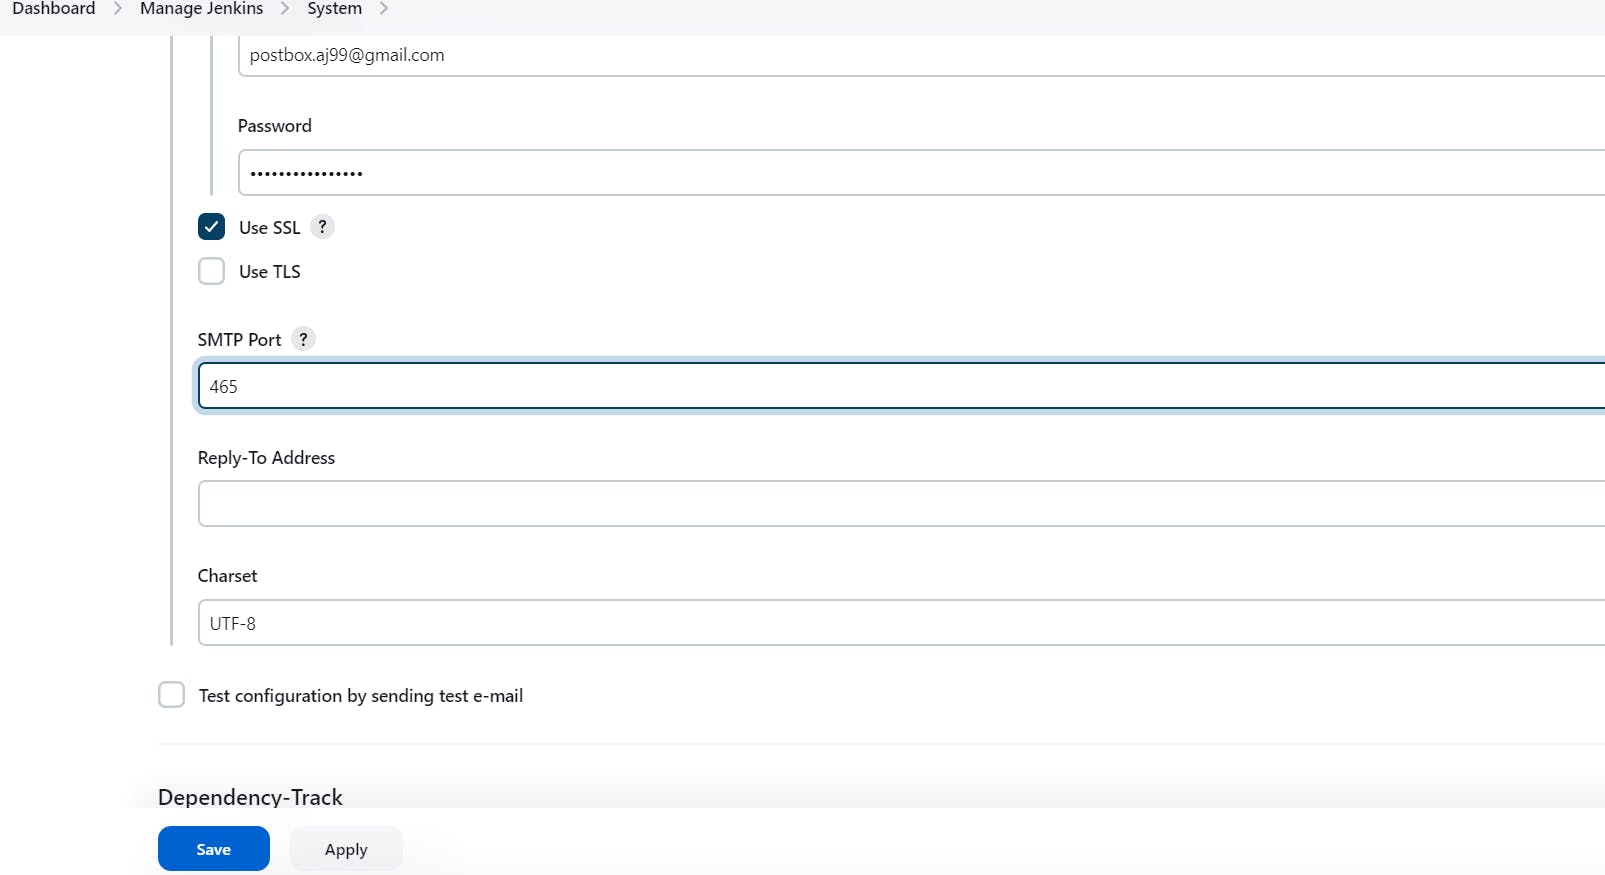
Click on Apply and save.
Click on Manage Jenkins--> credentials and add your mail username and generated password
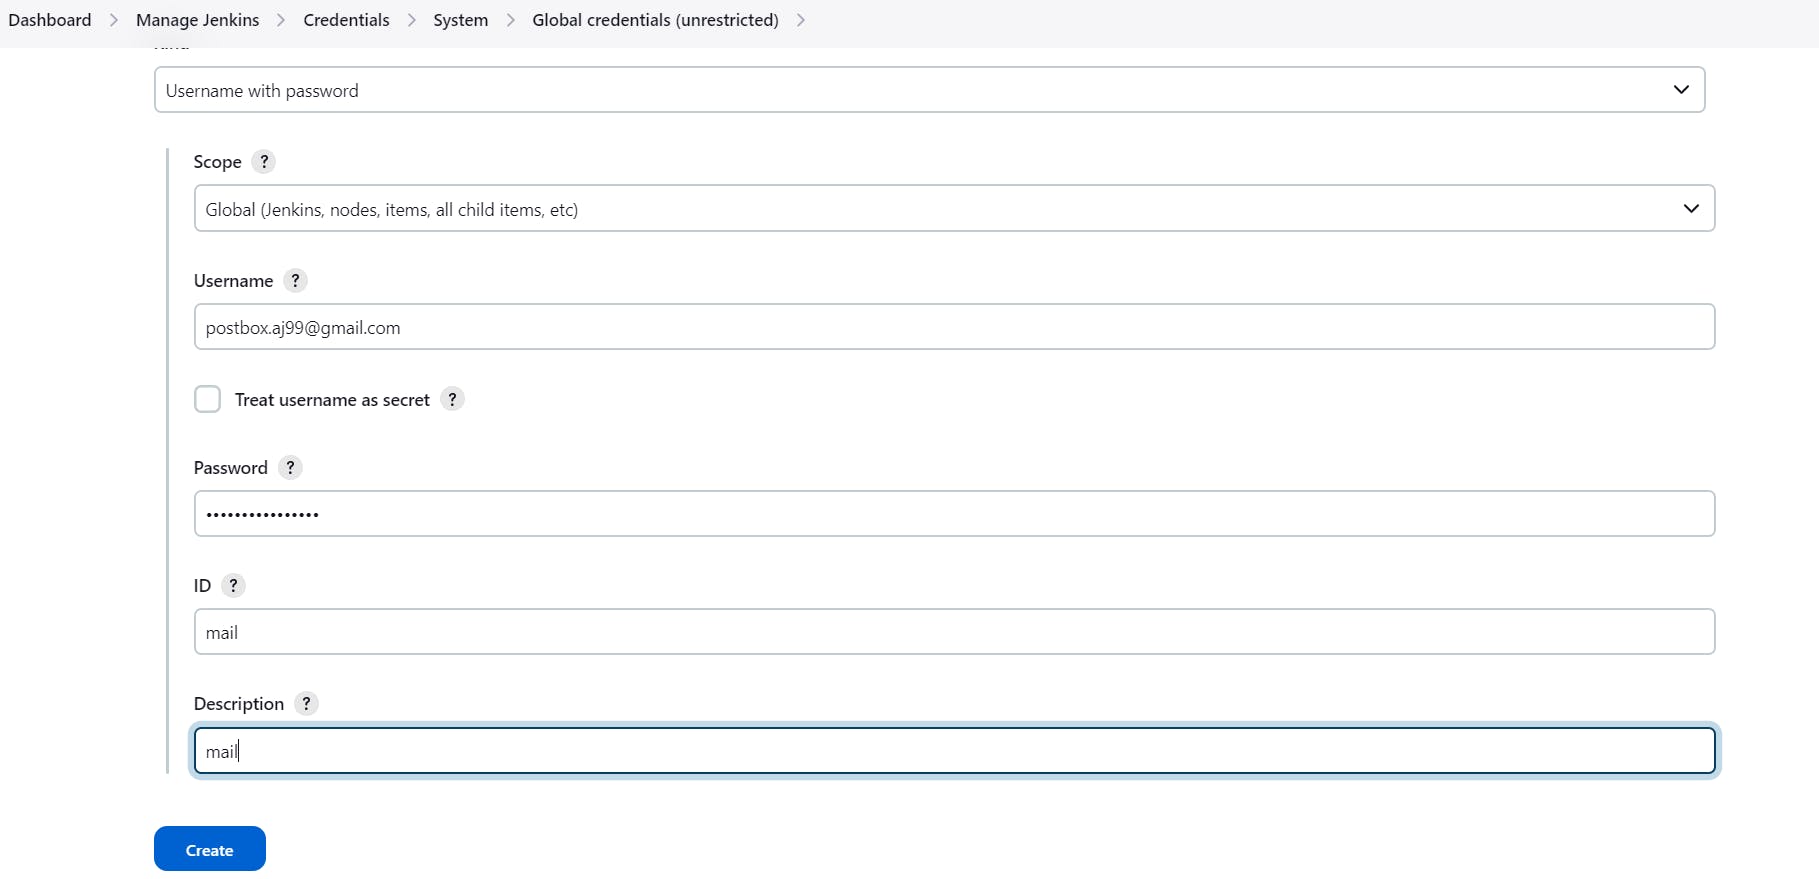
This is to just verify the mail configuration
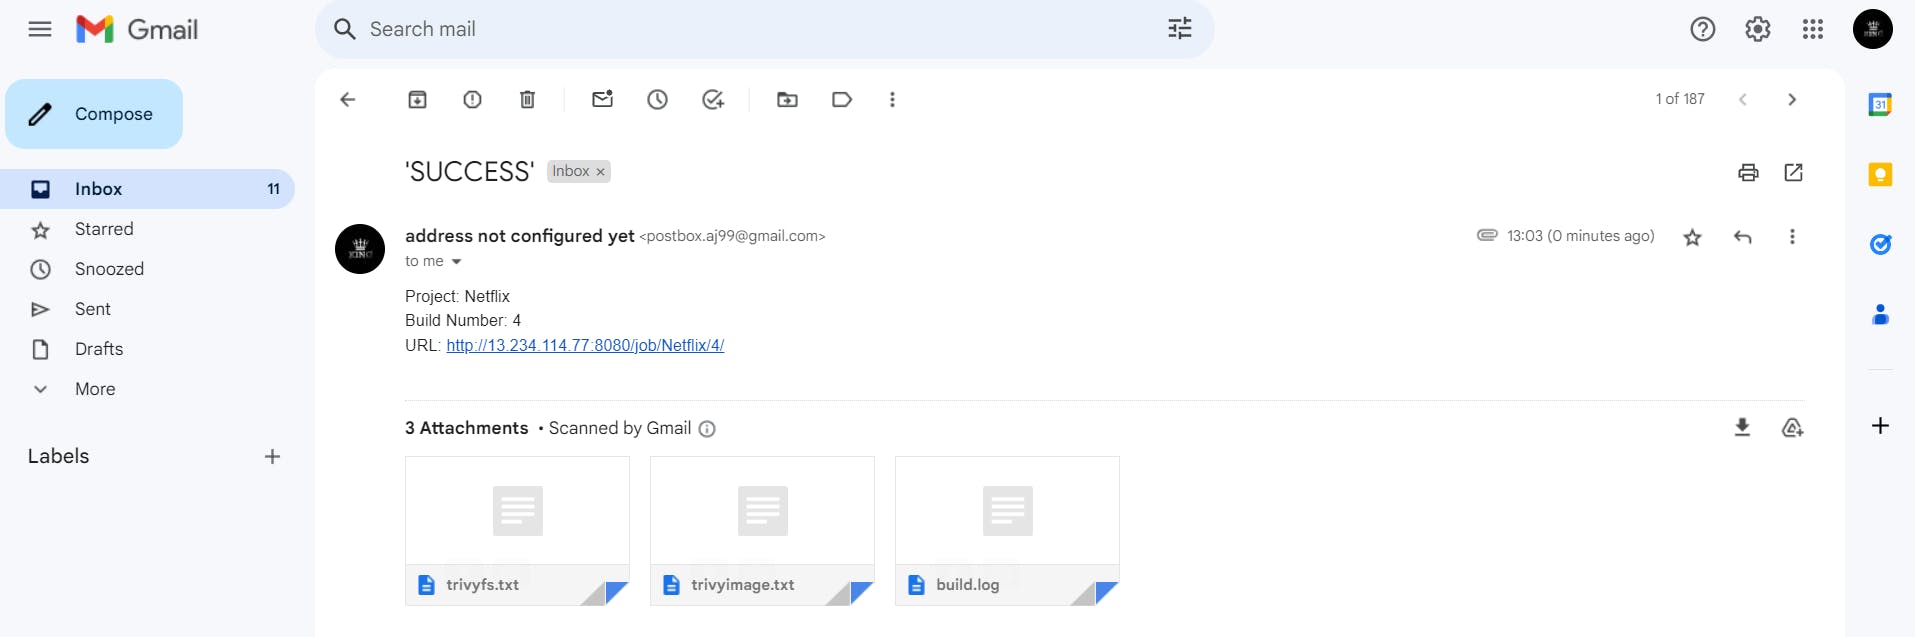
Now under the Extended E-mail Notification section configure the details as shown in the below images
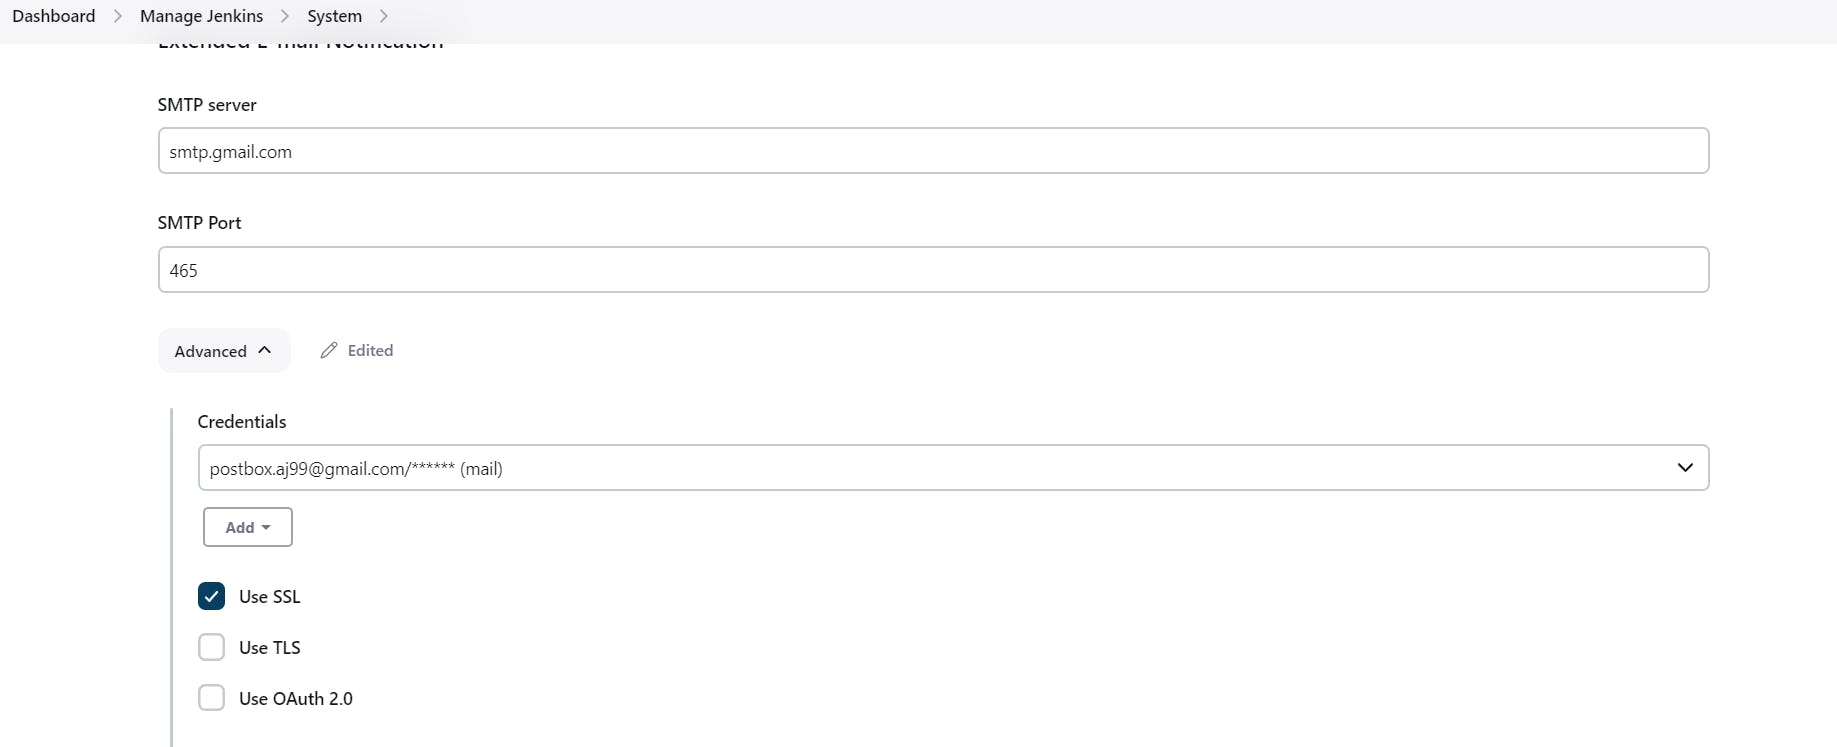
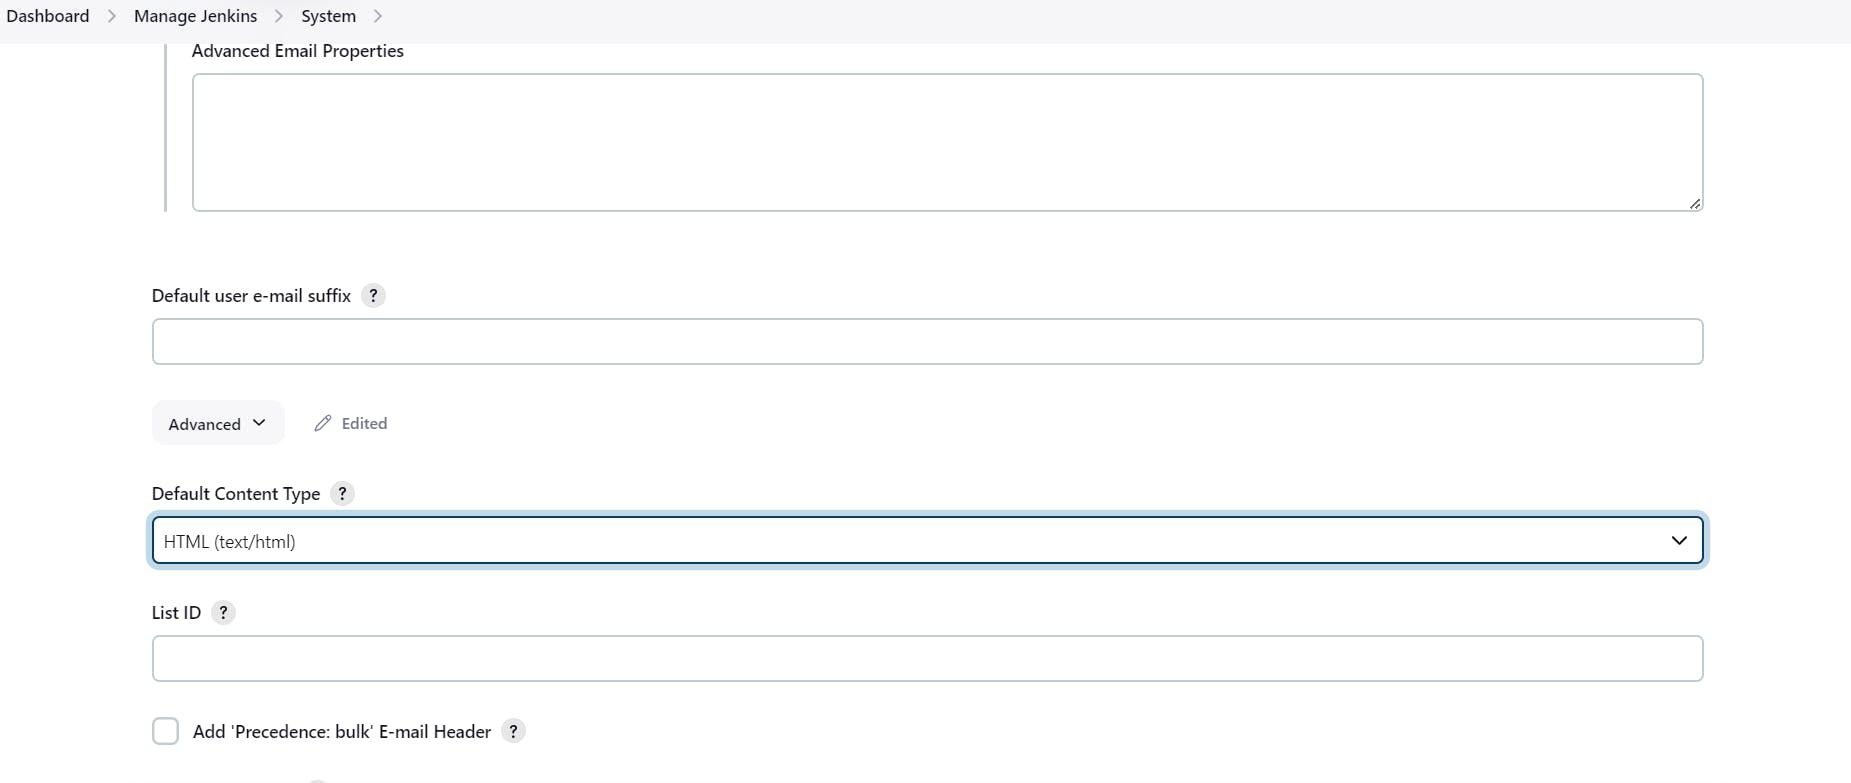
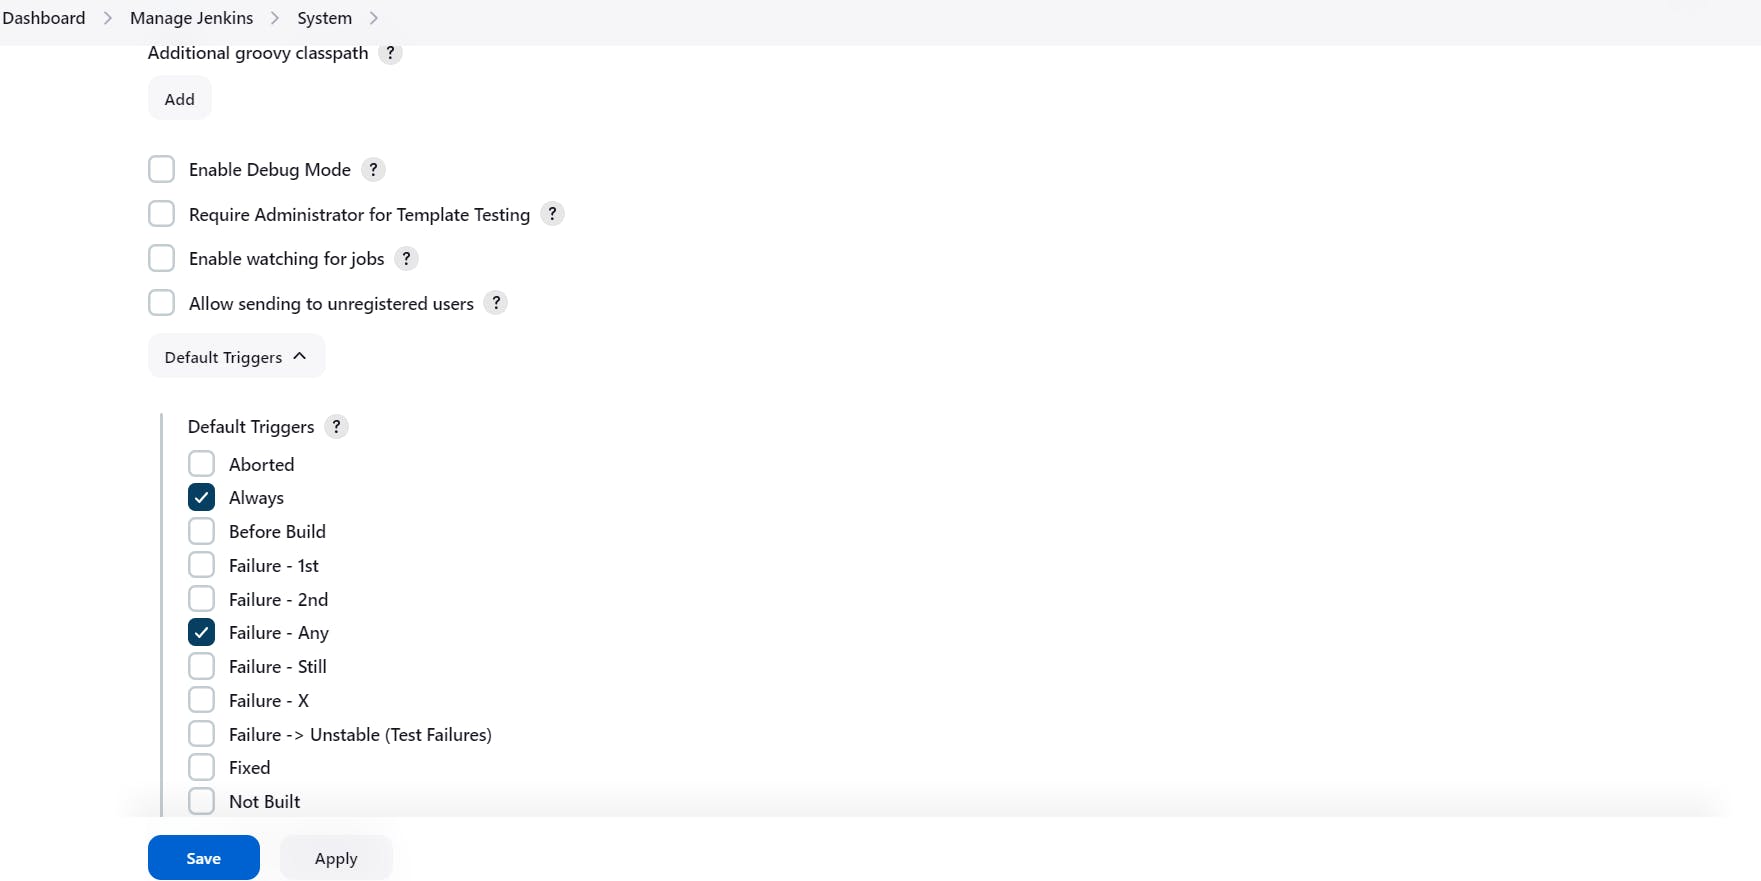
Click on Apply and save.
post {
     always {
        emailext attachLog: true,
            subject: "'${currentBuild.result}'",
            body: "Project: ${env.JOB_NAME}
" +
                "Build Number: ${env.BUILD_NUMBER}
" +
                "URL: ${env.BUILD_URL}
",
            to: 'postbox.aj99@gmail.com',  #change Your mail
            attachmentsPattern: 'trivyfs.txt,trivyimage.txt'
        }
    }
Next, we will log in to Jenkins and start to configure our Pipeline in Jenkins
Step 7 - Install Plugins like JDK, Sonarqube Scanner, NodeJs, OWASP Dependency Check
7A - Install Plugin
Goto Manage Jenkins →Plugins → Available Plugins →
Install below plugins
1 → Eclipse Temurin Installer (Install without restart)
2 → SonarQube Scanner (Install without restart)
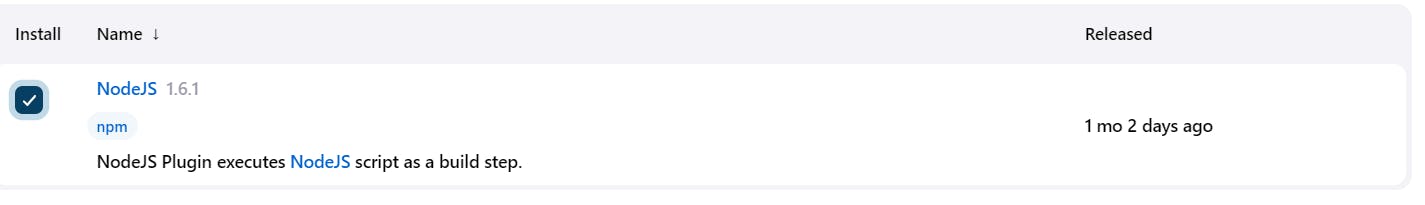
3 → NodeJs Plugin (Install Without restart)

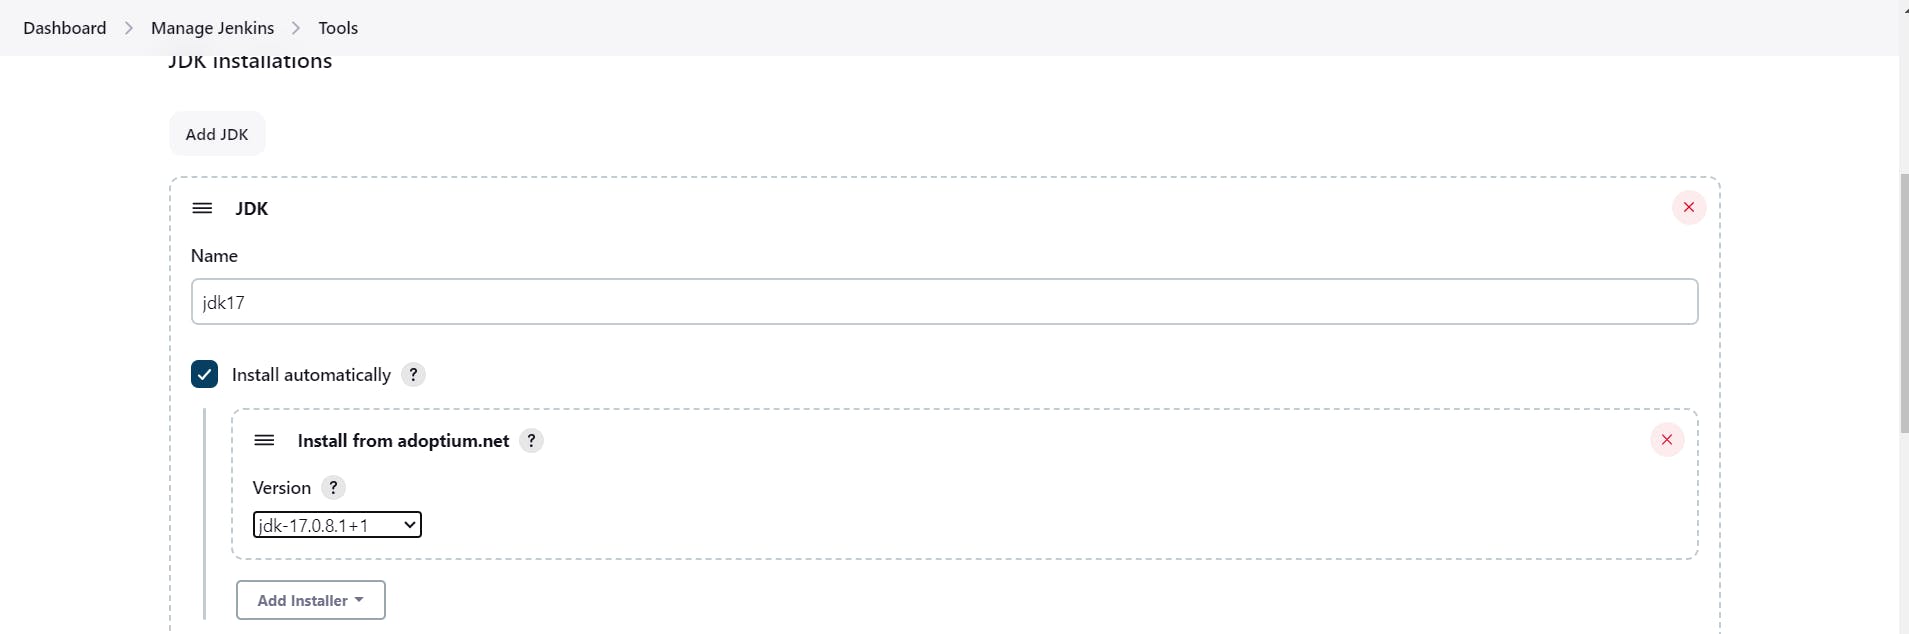
7B - Configure Java and Nodejs in Global Tool Configuration
Goto Manage Jenkins → Tools → Install JDK(17) and NodeJs(16)→ Click on Apply and Save
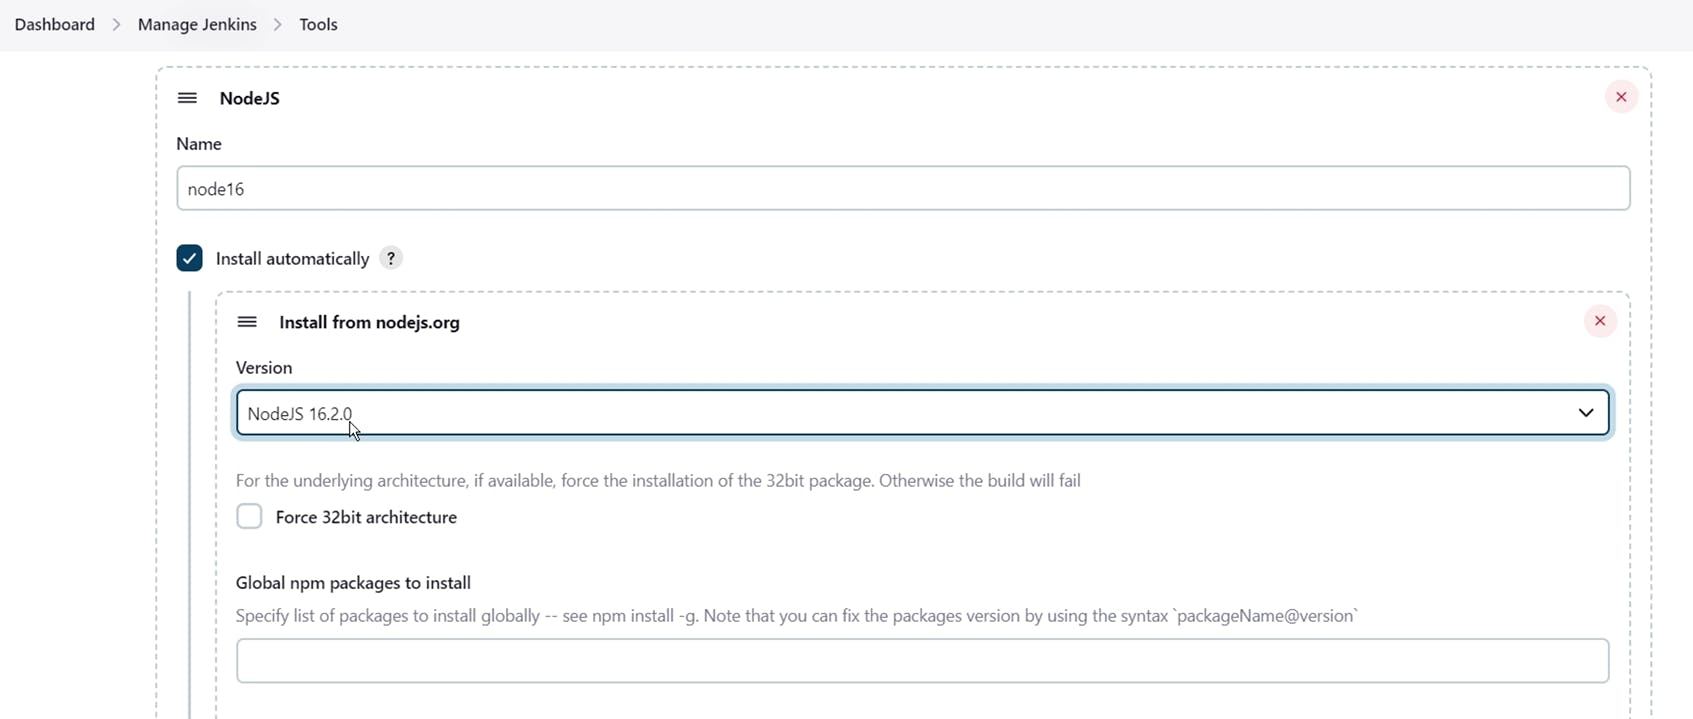
7C - Create a Job
create a job as Netflix Name, select pipeline and click on ok.
Step 8 - Configure Sonar Server in Manage Jenkins
Grab the Public IP Address of your EC2 Instance, Sonarqube works on Port 9000, so
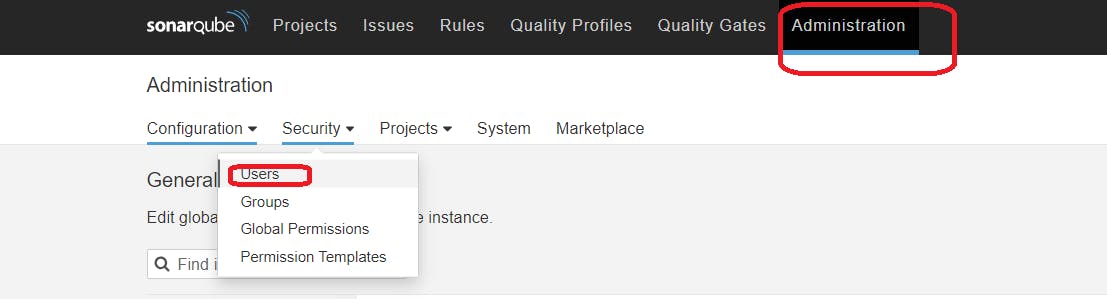
click on update Token
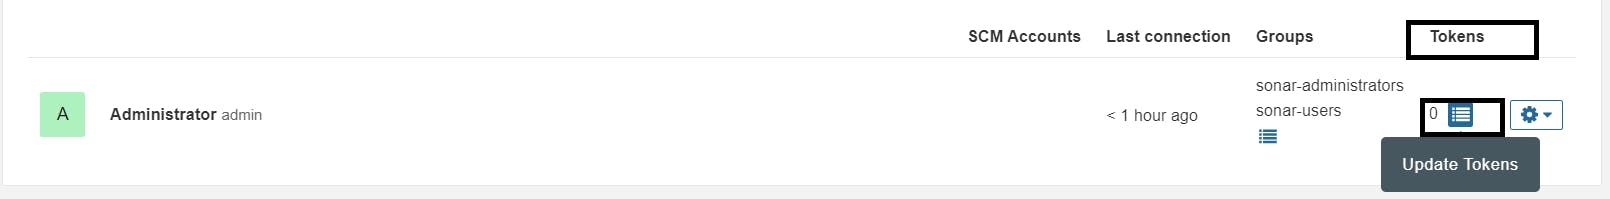
Create a token with a name and generate
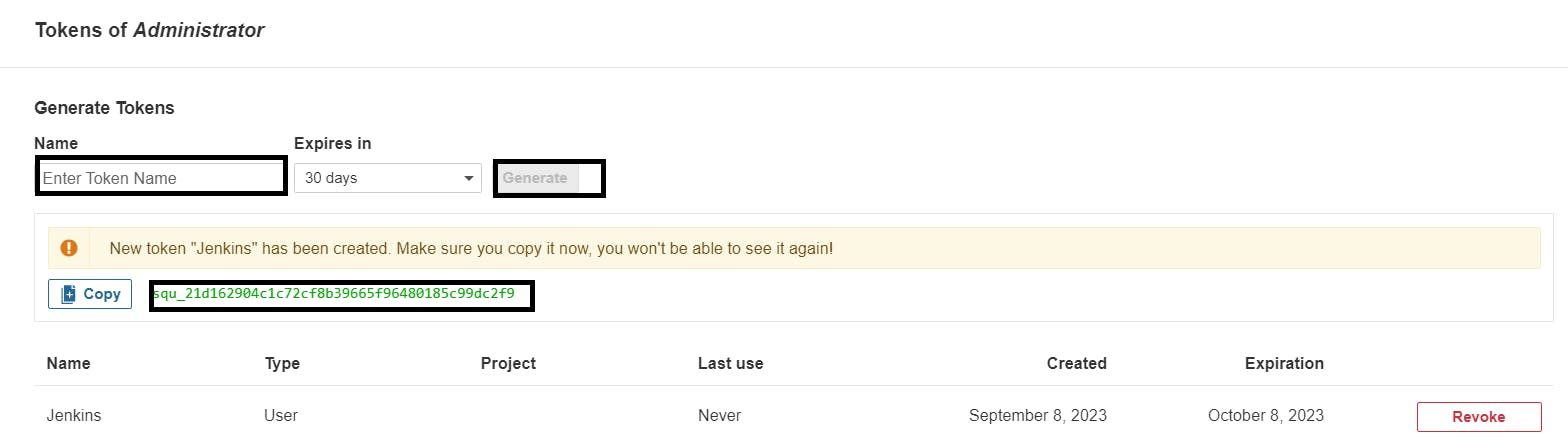
copy Token
Goto Jenkins Dashboard → Manage Jenkins → Credentials → Add Secret Text. It should look like this
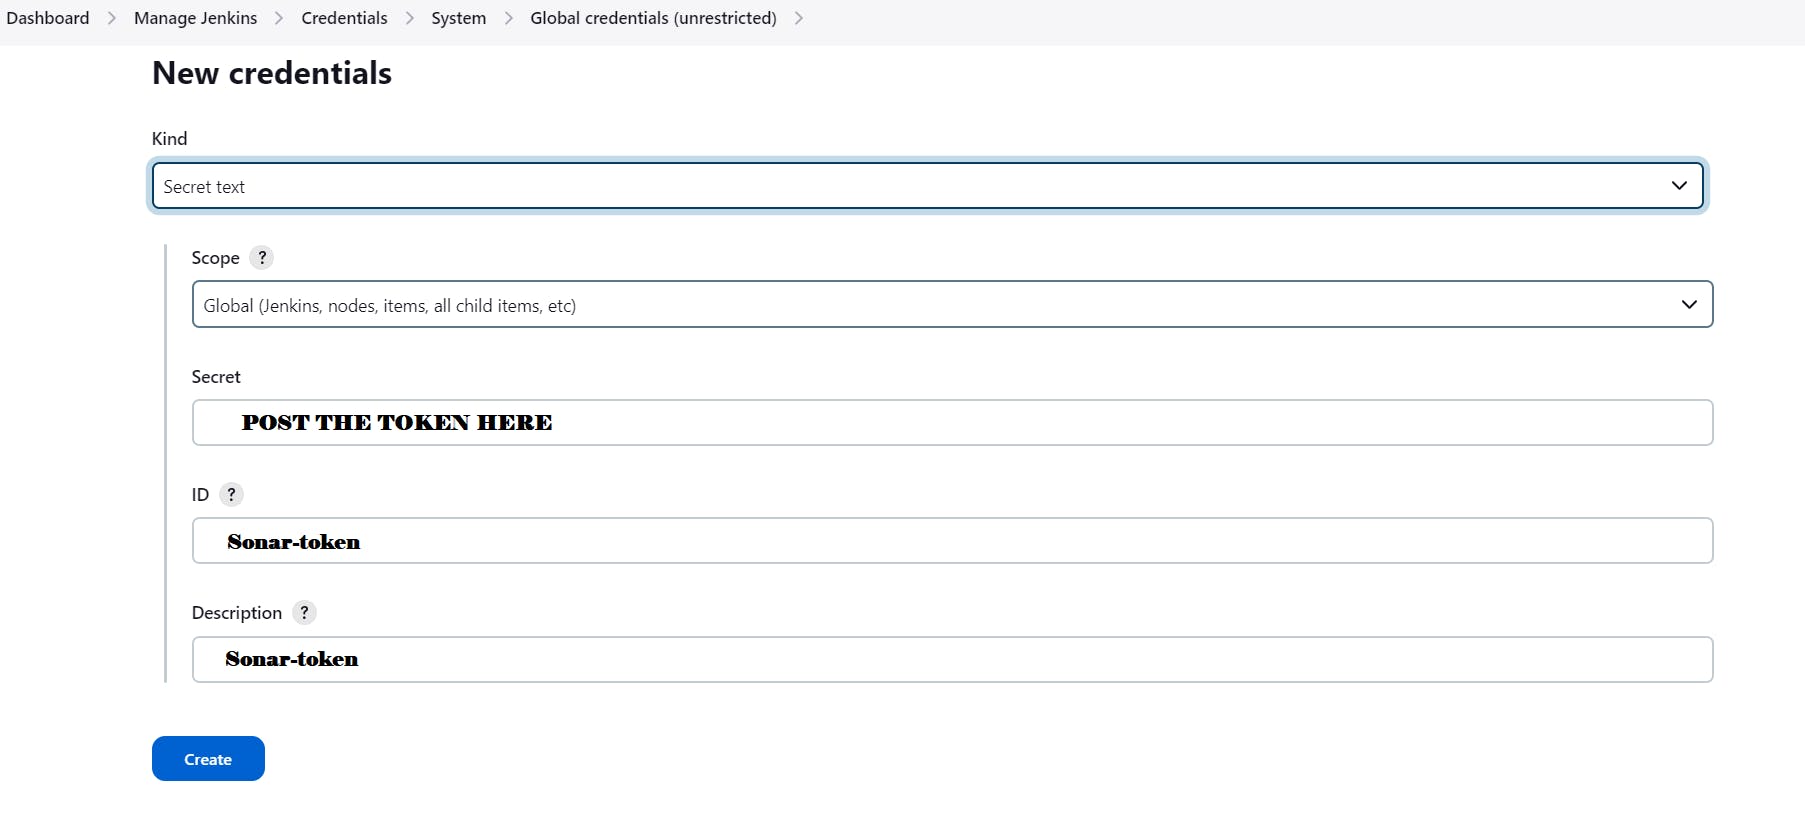
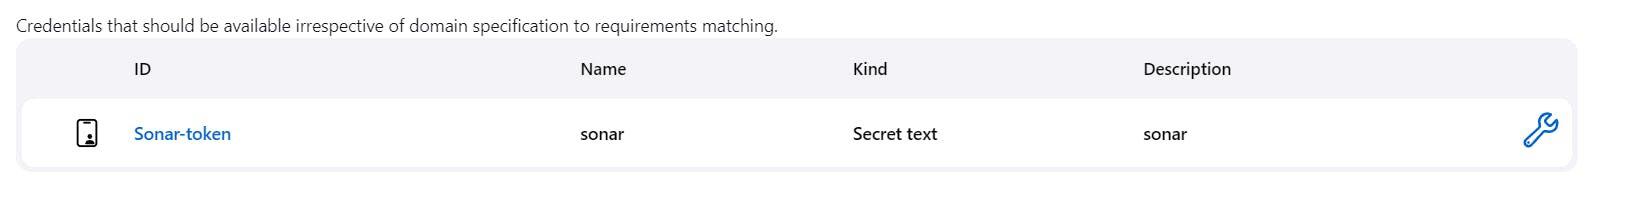
You will this page once you click on create
Now, go to Dashboard → Manage Jenkins → System and Add like the below image.
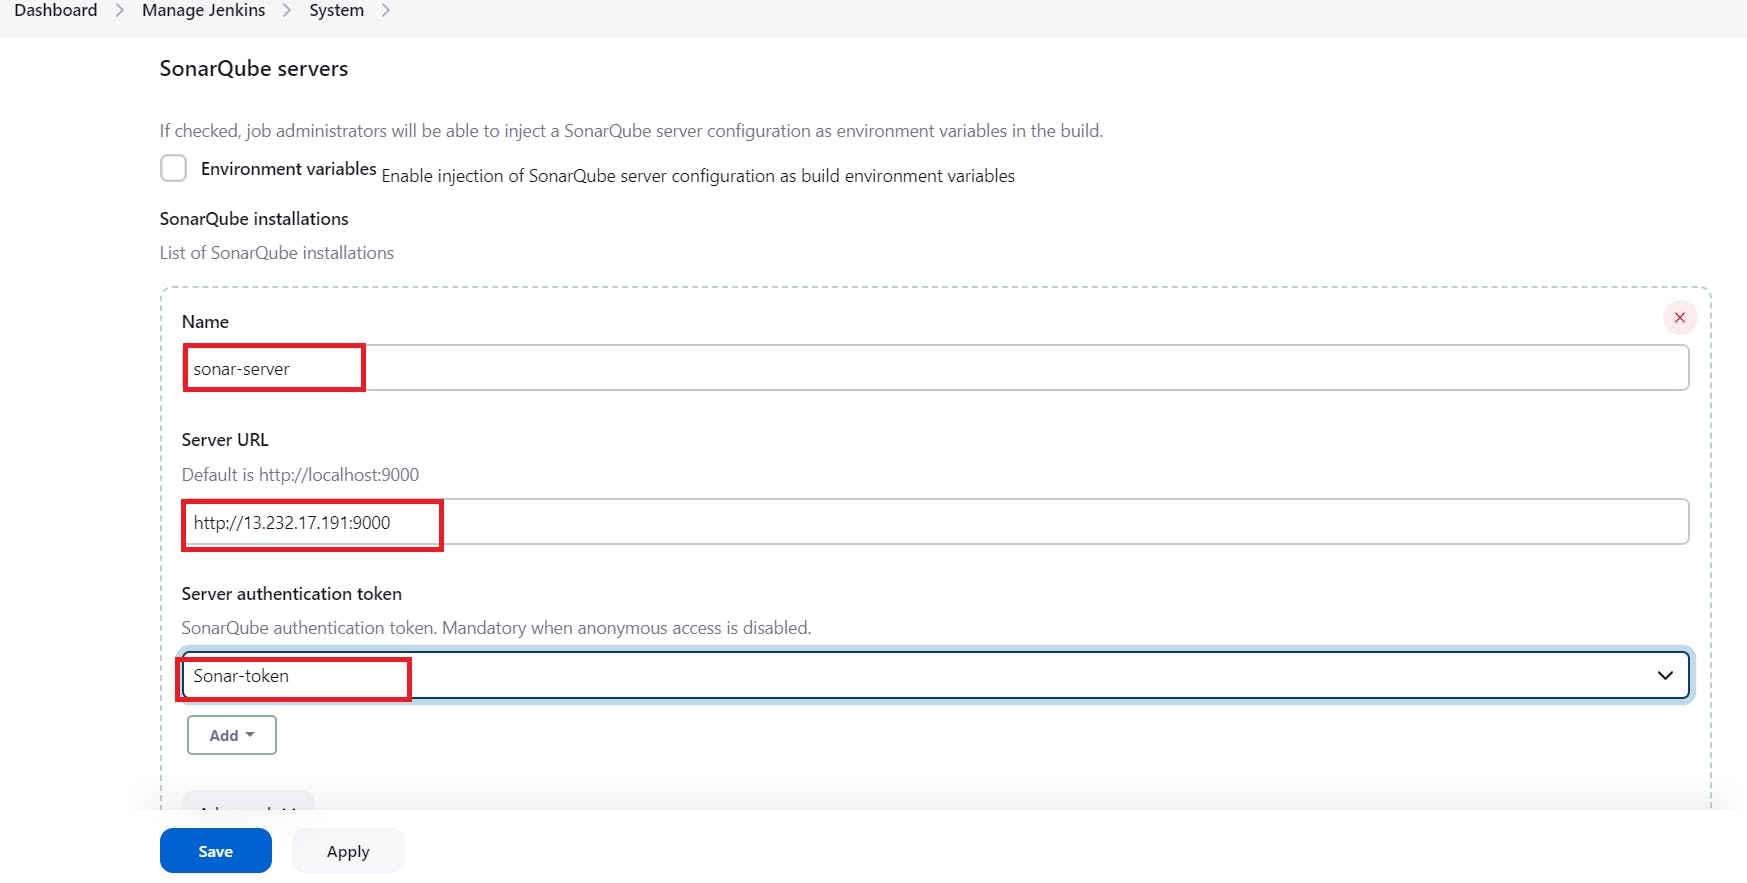
Click on Apply and Save
The Configure System option is used in Jenkins to configure different server
Global Tool Configuration is used to configure different tools that we install using Plugins
We will install a sonar scanner in the tools.

In the Sonarqube Dashboard add a quality gate also
Administration--> Configuration-->Webhooks

Click on Create

Add details
#in url section of quality gate
/sonarqube-webhook/

Let’s go to our Pipeline and add the script in our Pipeline Script.
pipeline{
    agent any
    tools{
        jdk 'jdk17'
        nodejs 'node16'
    }
    environment {
        SCANNER_HOME=tool 'sonar-scanner'
    }
    stages {
        stage('clean workspace'){
            steps{
                cleanWs()
            }
        }
        stage('Checkout from Git'){
            steps{
                git branch: 'main', url: 'https://github.com/Aj7Ay/Netflix-clone.git'
            }
        }
        stage("Sonarqube Analysis "){
            steps{
                withSonarQubeEnv('sonar-server') {
                    sh ''' $SCANNER_HOME/bin/sonar-scanner -Dsonar.projectName=Netflix \
                    -Dsonar.projectKey=Netflix '''
                }
            }
        }
        stage("quality gate"){
           steps {
                script {
                    waitForQualityGate abortPipeline: false, credentialsId: 'Sonar-token'
                }
            }
        }
        stage('Install Dependencies') {
            steps {
                sh "npm install"
            }
        }
    }
    post {
     always {
        emailext attachLog: true,
            subject: "'${currentBuild.result}'",
            body: "Project: ${env.JOB_NAME}
" +
                "Build Number: ${env.BUILD_NUMBER}
" +
                "URL: ${env.BUILD_URL}
",
            to: 'postbox.aj99@gmail.com',
            attachmentsPattern: 'trivyfs.txt,trivyimage.txt'
        }
    }
}
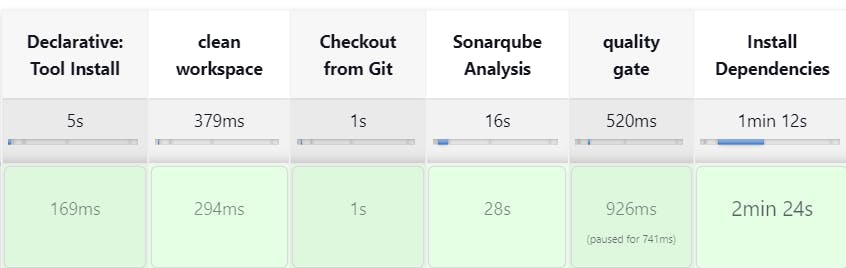
Click on Build now, you will see the stage view like this
To see the report, you can go to Sonarqube Server and go to Projects.
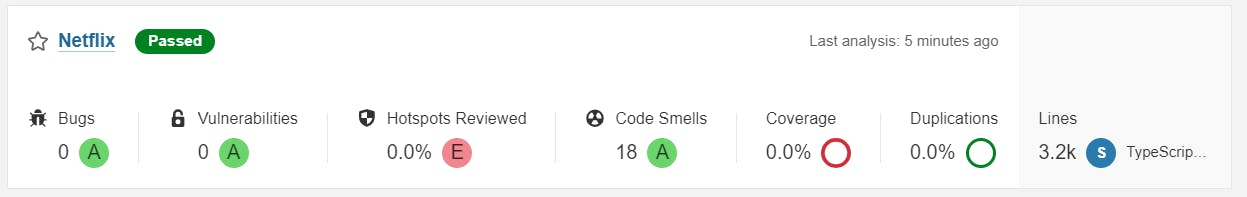
You can see the report has been generated and the status shows as passed. You can see that there are 3.2k lines it scanned. To see a detailed report, you can go to issues.
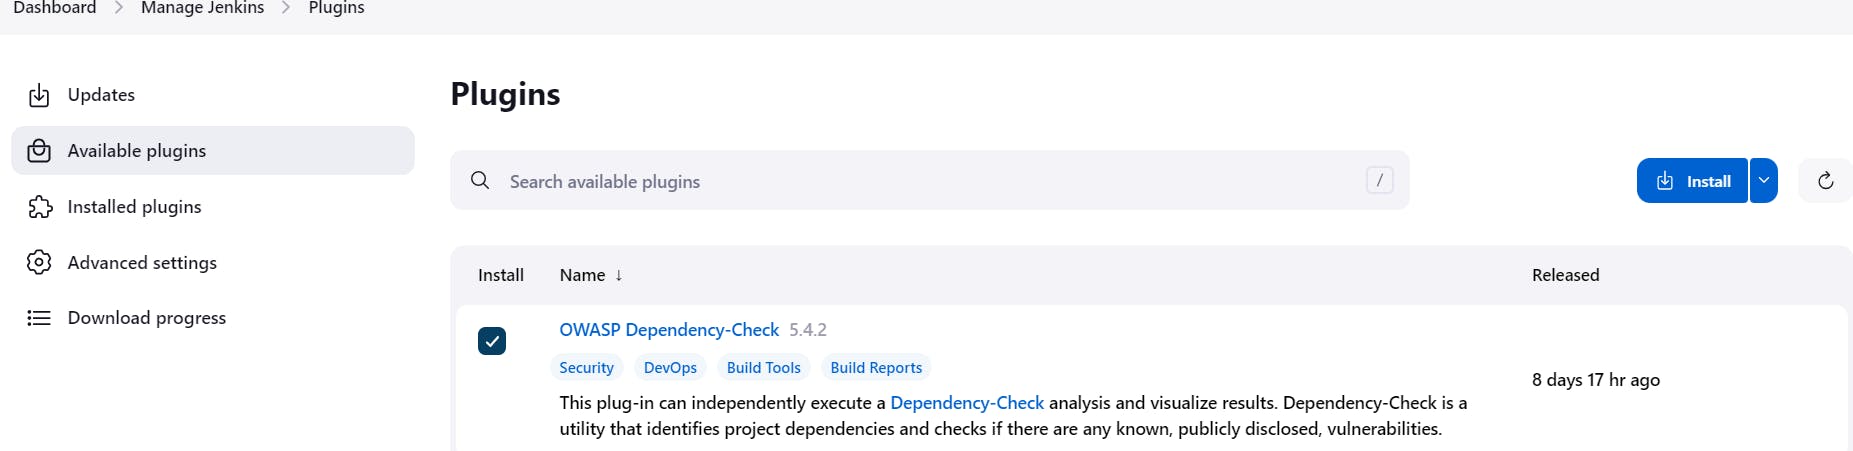
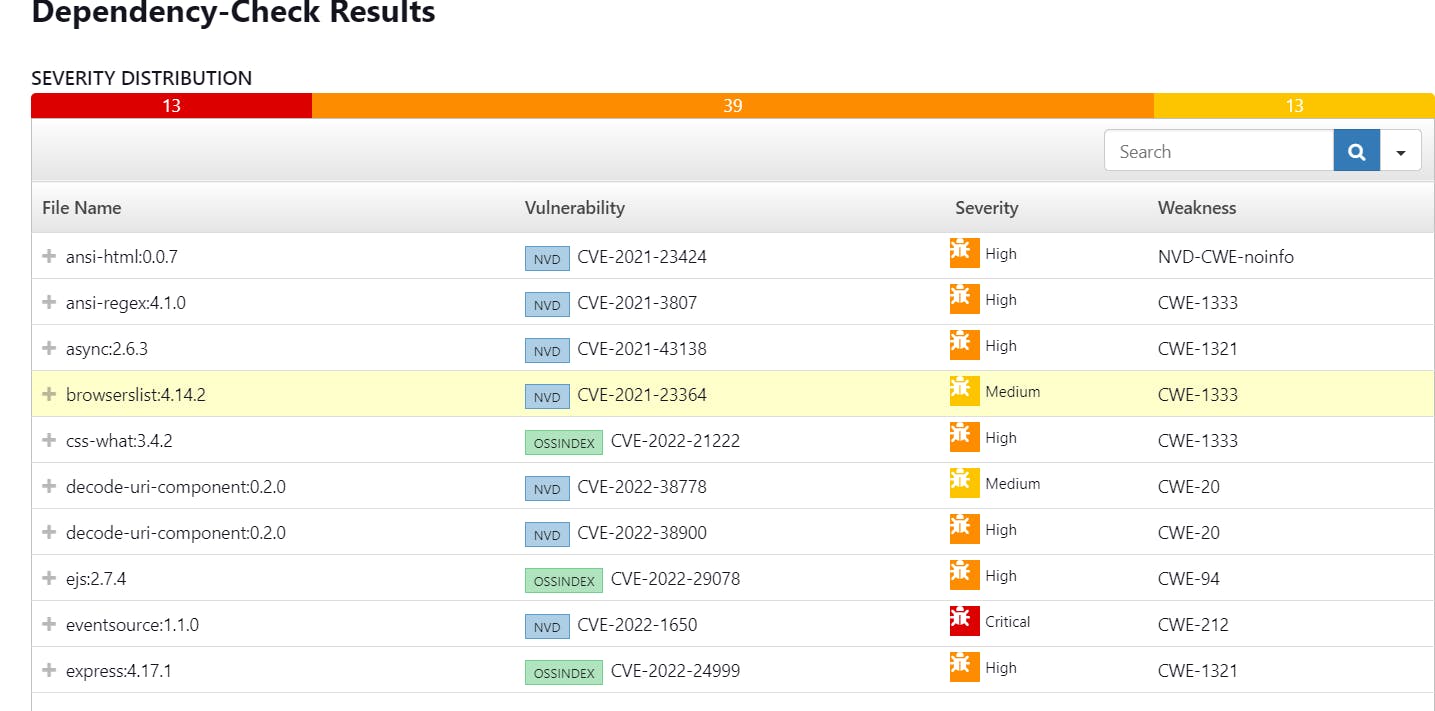
Step 9 - Install OWASP Dependency Check Plugins
GotoDashboard → Manage Jenkins → Plugins → OWASP Dependency-Check. Click on it and install it without restart.
First, we configured the Plugin and next, we had to configure the Tool
Goto Dashboard → Manage Jenkins → Tools →
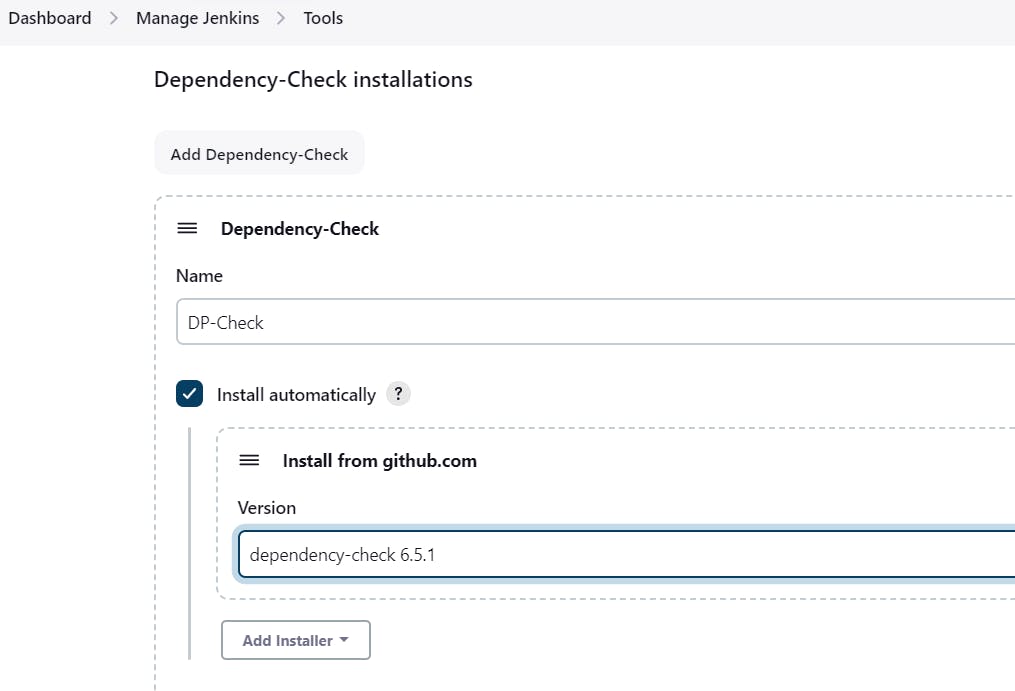
Click on Apply and Save here.
Now go configure → Pipeline and add this stage to your pipeline and build.
stage('OWASP FS SCAN') {
            steps {
                dependencyCheck additionalArguments: '--scan ./ --disableYarnAudit --disableNodeAudit', odcInstallation: 'DP-Check'
                dependencyCheckPublisher pattern: '**/dependency-check-report.xml'
            }
        }
        stage('TRIVY FS SCAN') {
            steps {
                sh "trivy fs . > trivyfs.txt"
            }
        }
The stage view would look like this,
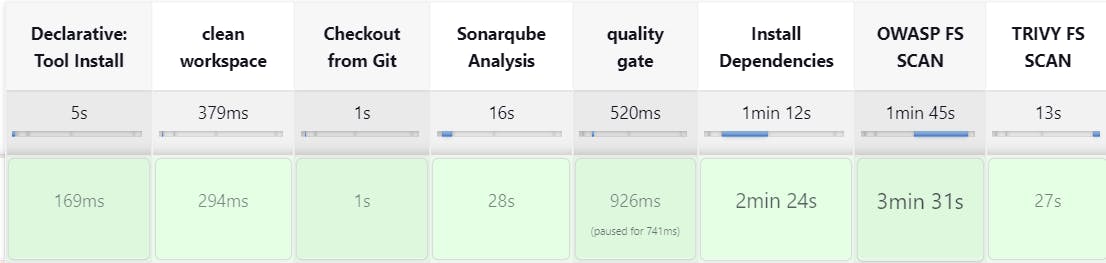
You will see that in status, a graph will also be generated and Vulnerabilities.
Step 10 - Docker Image Build and Push
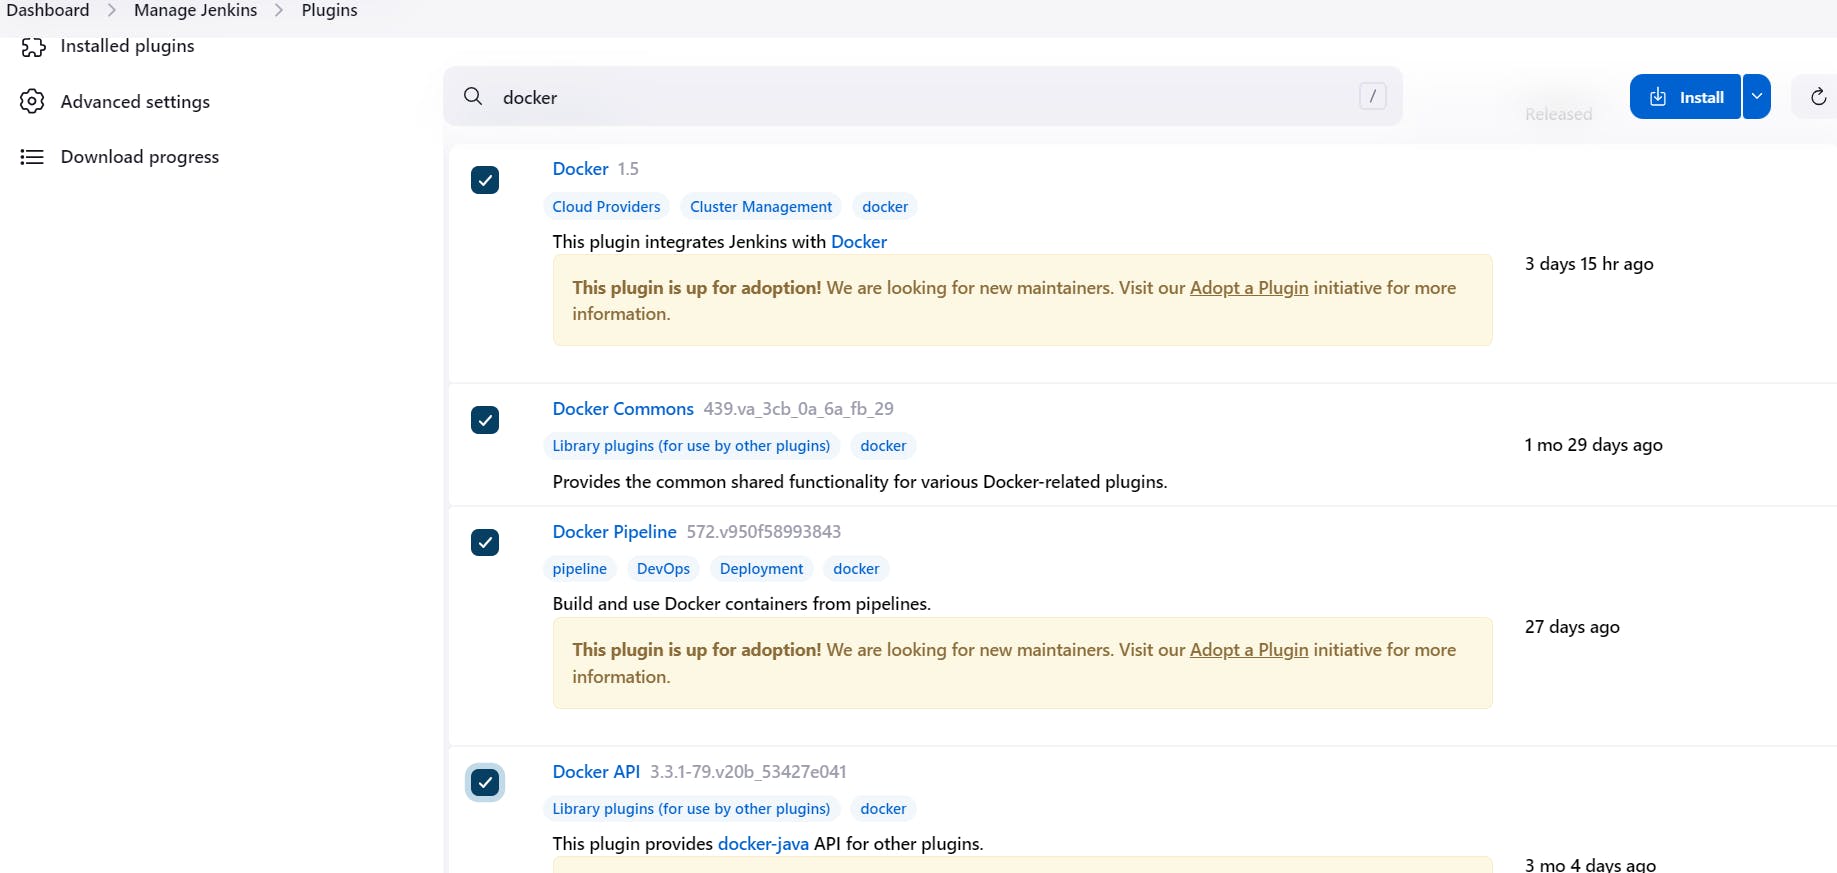
We need to install the Docker tool in our system, Goto Dashboard → Manage Plugins → Available plugins → Search for Docker and install these plugins
Docker
Docker Commons
Docker Pipeline
Docker API
docker-build-step
and click on install without restart
Now, goto Dashboard → Manage Jenkins → Tools →

Add DockerHub Username and Password under Global Credentials

Add this stage to Pipeline Script
stage("Docker Build & Push"){
            steps{
                script{
                   withDockerRegistry(credentialsId: 'docker', toolName: 'docker'){
                       sh "docker build --build-arg TMDB_V3_API_KEY=Aj7ay86fe14eca3e76869b92 -t netflix ."
                       sh "docker tag netflix sevenajay/netflix:latest "
                       sh "docker push sevenajay/netflix:latest "
                    }
                }
            }
        }
        stage("TRIVY"){
            steps{
                sh "trivy image sevenajay/netflix:latest > trivyimage.txt"
            }
        }
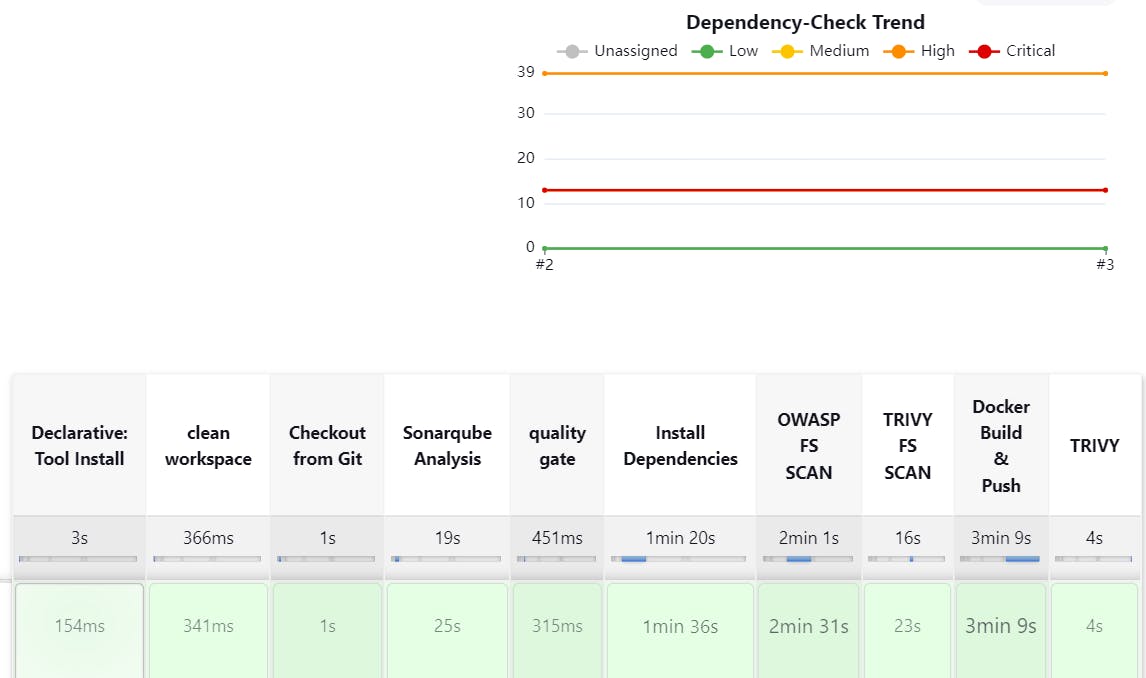
You will see the output below, with a dependency trend.
When you log in to Dockerhub, you will see a new image is created

Now Run the container to see if the game coming up or not by adding the below stage
stage('Deploy to container'){
            steps{
                sh 'docker run -d --name netflix -p 8081:80 sevenajay/netflix:latest'
            }
        }
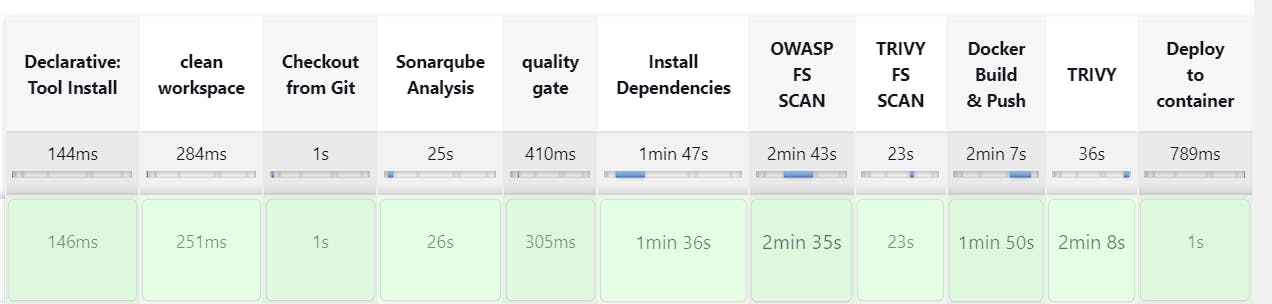
stage view
<Jenkins-public-ip:8081>
You will get this output
Step 11 - Kuberenetes Setup
Connect your machines to Putty or Mobaxtreme
USE THIS SETUP PLEASE ( since 20.04 is not available anymore )
https://mrcloudbook.com/ultimate-guide-setting-up-a-kubernetes-cluster-with-master-and-worker-nodes-on-ubuntu-24-04-for-optimal-performance/
sudo kubeadm init --pod-network-cidr=10.244.0.0/16
# in case your in root exit from it and run below commands
mkdir -p $HOME/.kube
sudo cp -i /etc/kubernetes/admin.conf $HOME/.kube/config
sudo chown $(id -u):$(id -g) $HOME/.kube/config
kubectl apply -f https://raw.githubusercontent.com/coreos/flannel/master/Documentation/kube-flannel.yml
Copy the config file to Jenkins master or the local file manager and save it
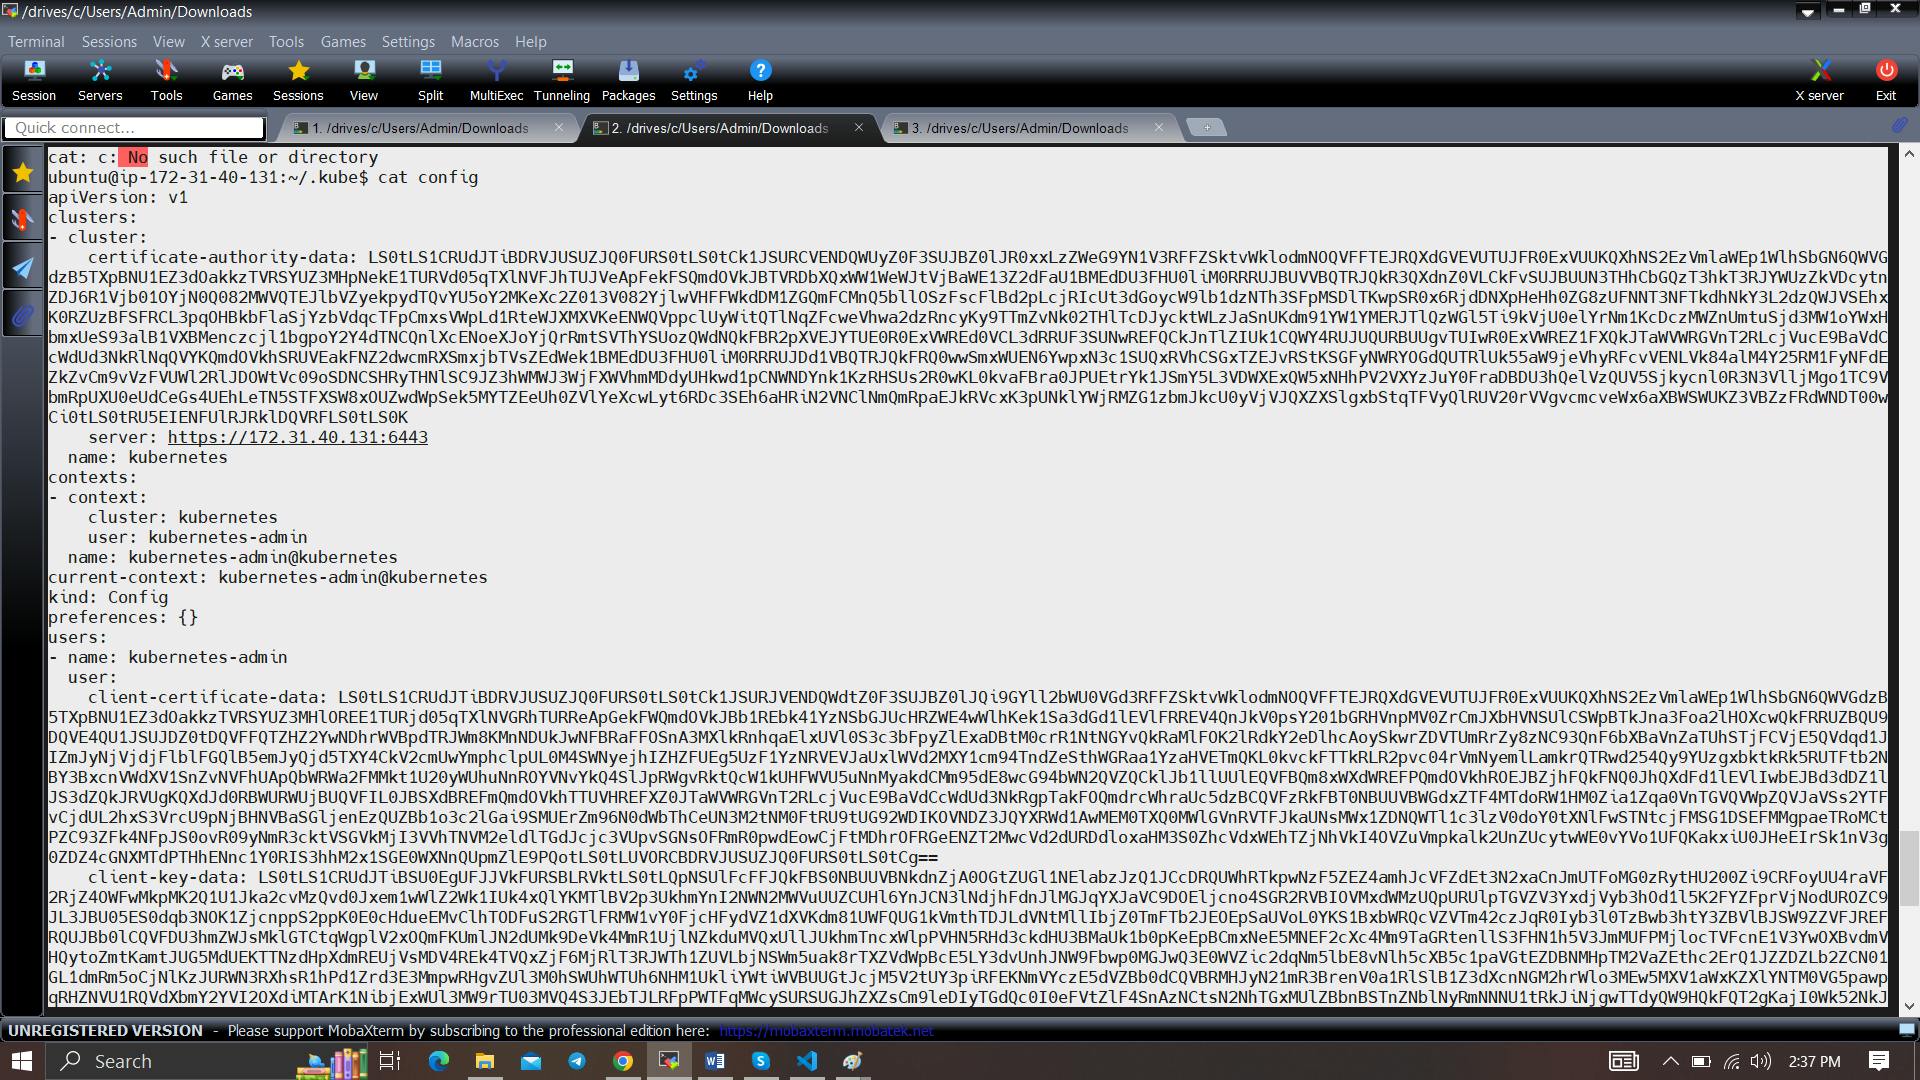
copy it and save it in documents or another folder save it as secret-file.txt
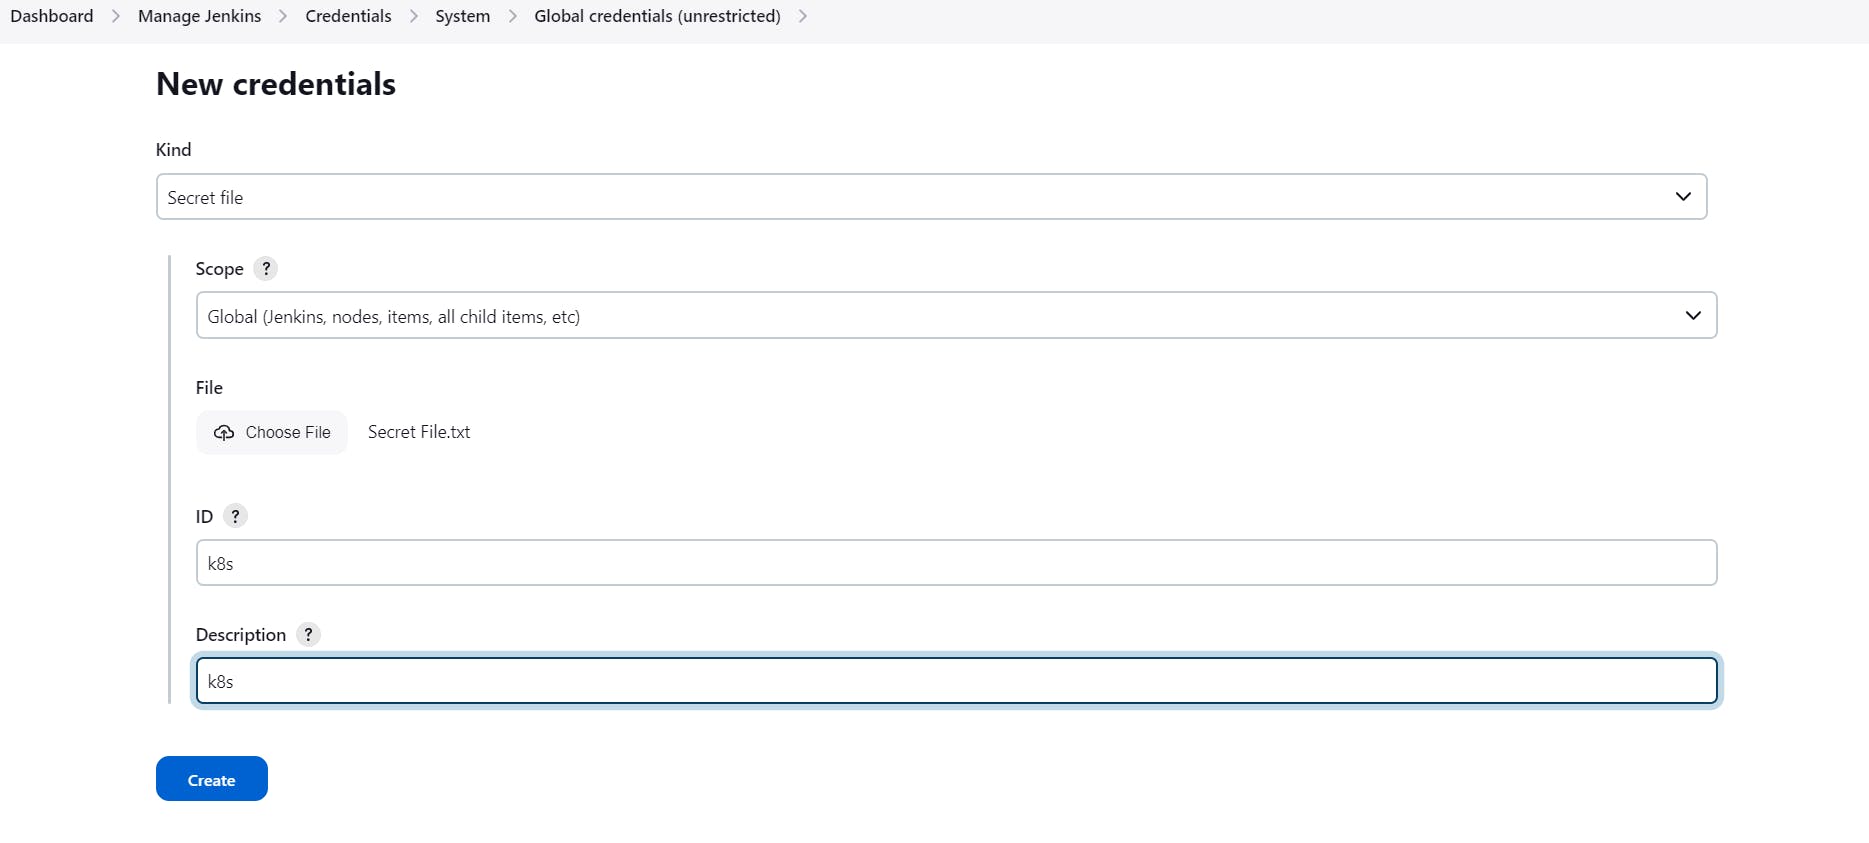
Note: create a secret-file.txt in your file explorer save the config in it and use this at the kubernetes credential section.
Install Kubernetes Plugin, Once it’s installed successfully
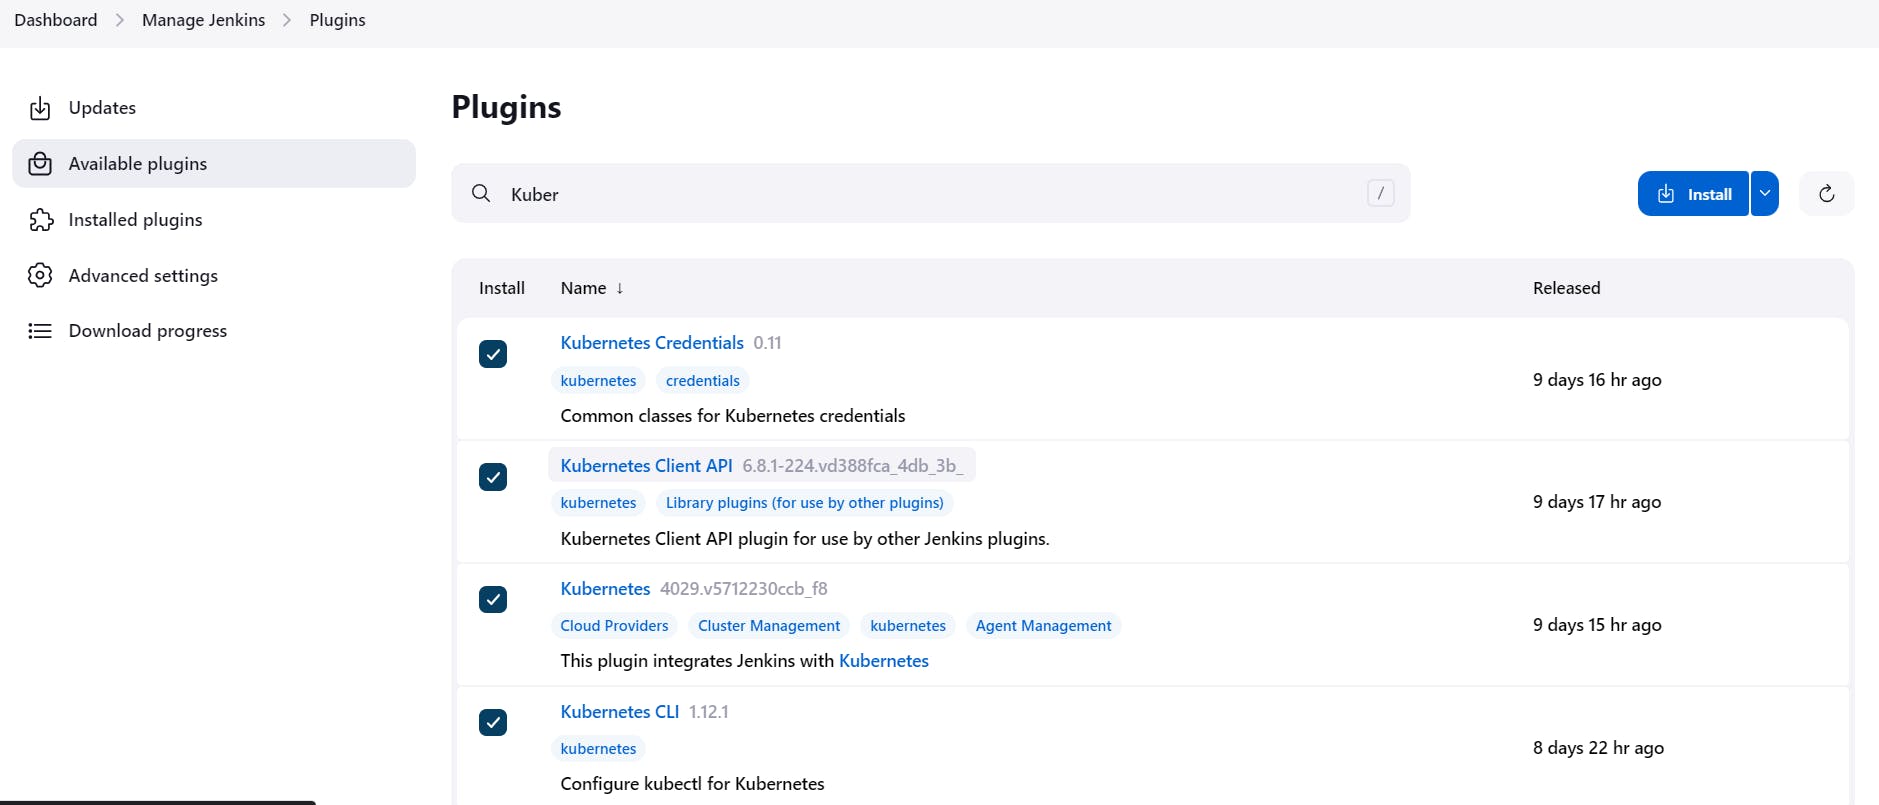
goto manage Jenkins --> manage credentials --> Click on Jenkins global --> add credentials
Install Node_exporter on both master and worker
Let’s add Node_exporter on Master and Worker to monitor the metrics
First, let’s create a system user for Node Exporter by running the following command:
sudo useradd \
    --system \
    --no-create-home \
    --shell /bin/false node_exporter

You can download Node Exporter from the same page.
Use the wget command to download the binary.
wget https://github.com/prometheus/node_exporter/releases/download/v1.6.1/node_exporter-1.6.1.linux-amd64.tar.gz

Extract the node exporter from the archive.
tar -xvf node_exporter-1.6.1.linux-amd64.tar.gz

Move binary to the /usr/local/bin.
sudo mv \
  node_exporter-1.6.1.linux-amd64/node_exporter \
  /usr/local/bin/

Clean up, and delete node_exporter archive and a folder.
rm -rf node_exporter*

Verify that you can run the binary.
node_exporter --version

Node Exporter has a lot of plugins that we can enable. If you run Node Exporter help you will get all the options.
node_exporter --help
--collector.logind We’re going to enable the login controller, just for the demo.
Next, create a similar systemd unit file.
sudo vim /etc/systemd/system/node_exporter.service

node_exporter.service
[Unit]
Description=Node Exporter
Wants=network-online.target
After=network-online.target
StartLimitIntervalSec=500
StartLimitBurst=5
[Service]
User=node_exporter
Group=node_exporter
Type=simple
Restart=on-failure
RestartSec=5s
ExecStart=/usr/local/bin/node_exporter \
    --collector.logind
[Install]
WantedBy=multi-user.target

Replace Prometheus user and group to node_exporter, and update the ExecStart command.
To automatically start the Node Exporter after reboot, enable the service.
sudo systemctl enable node_exporter
Then start the Node Exporter.
sudo systemctl start node_exporter

Check the status of Node Exporter with the following command:
sudo systemctl status node_exporter

If you have any issues, check logs with journalctl
journalctl -u node_exporter -f --no-pager
At this point, we have only a single target in our Prometheus. There are many different service discovery mechanisms built into Prometheus. For example, Prometheus can dynamically discover targets in AWS, GCP, and other clouds based on the labels. In the following tutorials, I’ll give you a few examples of deploying Prometheus in a cloud-specific environment. For this tutorial, let’s keep it simple and keep adding static targets. Also, I have a lesson on how to deploy and manage Prometheus in the Kubernetes cluster.
To create a static target, you need to add job_name with static_configs. Go to Prometheus server
sudo vim /etc/prometheus/prometheus.yml

prometheus.yml
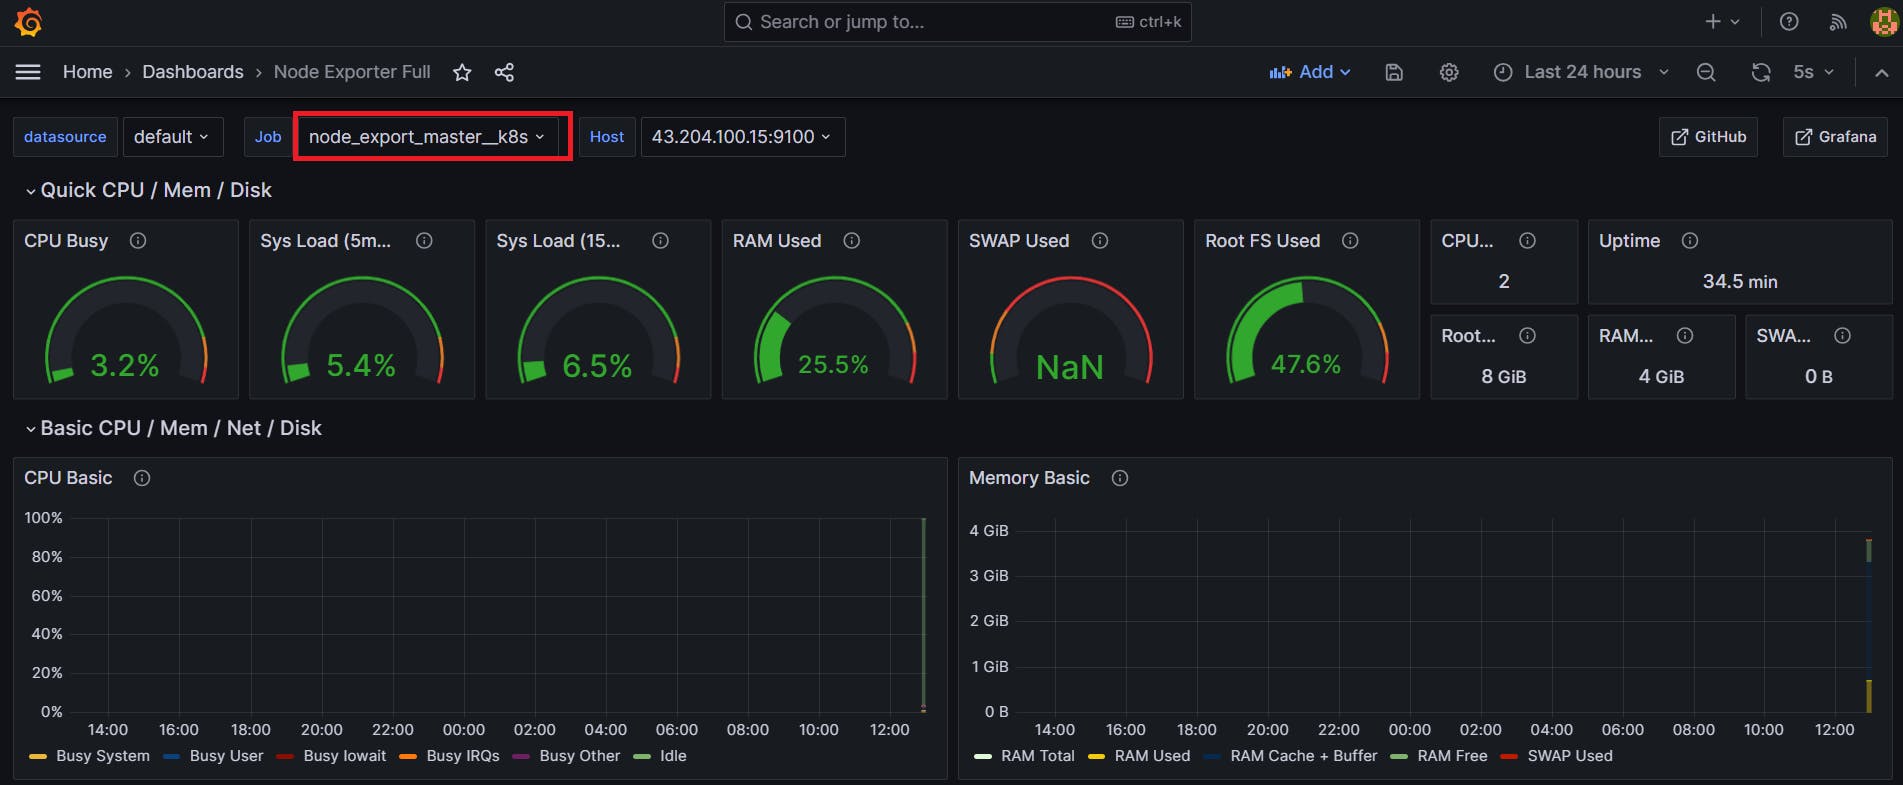
- job_name: node_export_masterk8s
static_configs:
- targets: [":9100"]
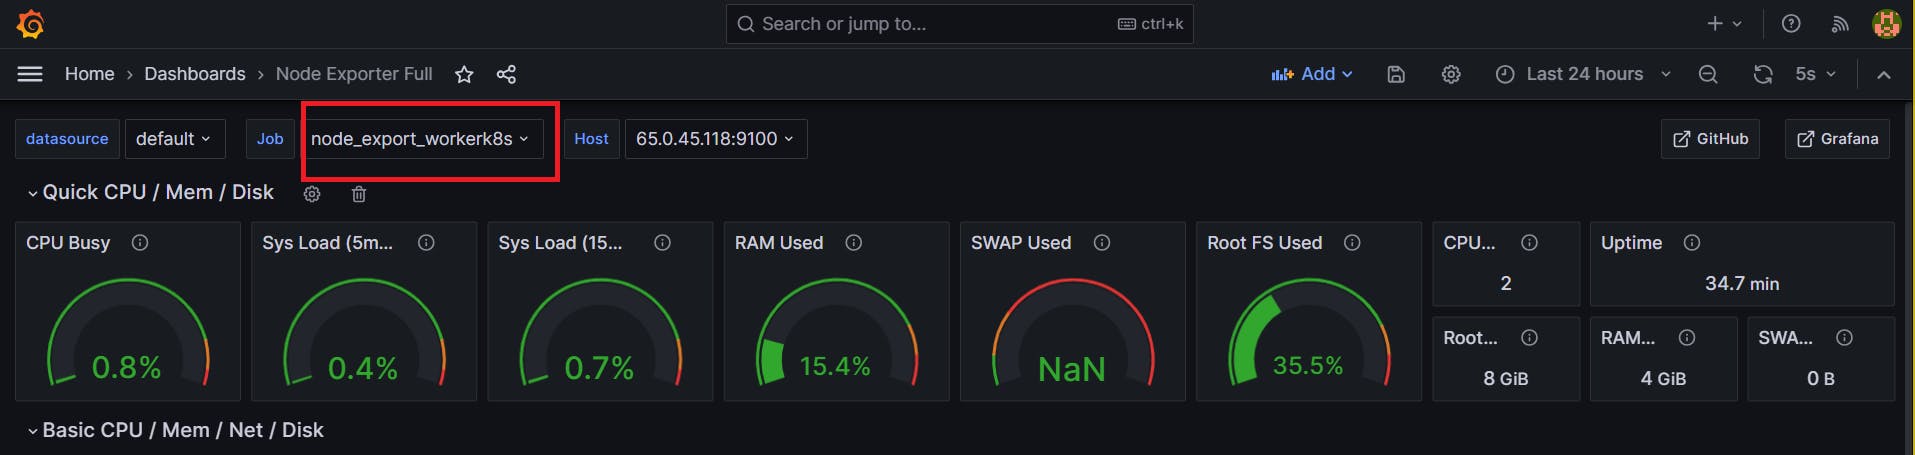
- job_name: node_export_workerk8s
static_configs:
- targets: [":9100"]
By default, Node Exporter will be exposed on port 9100.
Since we enabled lifecycle management via API calls, we can reload the Prometheus config without restarting the service and causing downtime.
Before, restarting check if the config is valid.
promtool check config /etc/prometheus/prometheus.yml
Then, you can use a POST request to reload the config.
curl -X POST http://localhost:9090/-/reload

Check the targets section
http://:9090/targets
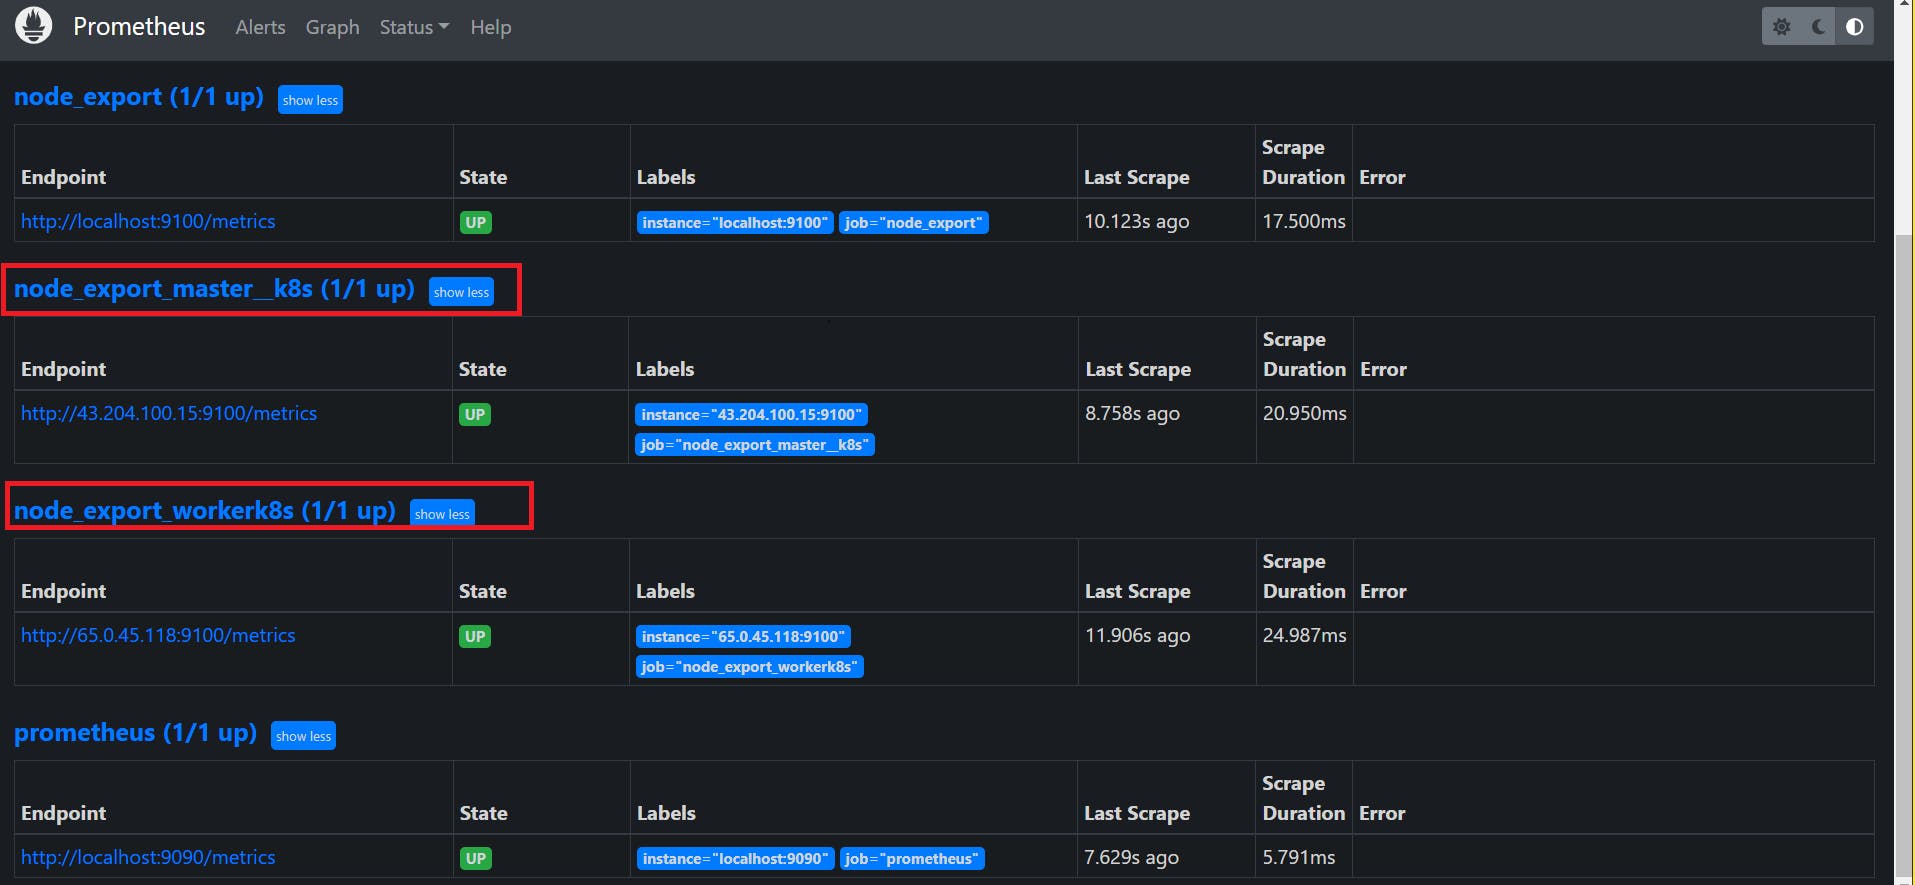
final step to deploy on the Kubernetes cluster
stage('Deploy to kubernets'){
            steps{
                script{
                    dir('Kubernetes') {
                        withKubeConfig(caCertificate: '', clusterName: '', contextName: '', credentialsId: 'k8s', namespace: '', restrictKubeConfigAccess: false, serverUrl: '') {
                                sh 'kubectl apply -f deployment.yml'
                                sh 'kubectl apply -f service.yml'
                        }
                    }
                }
            }
        }
stage view
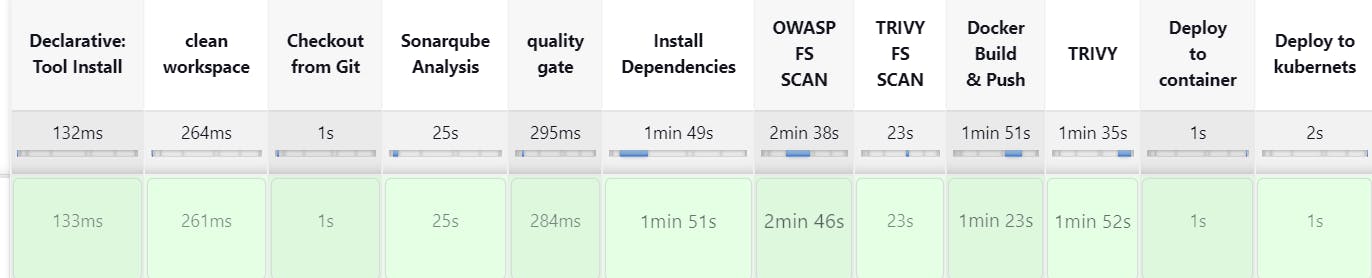
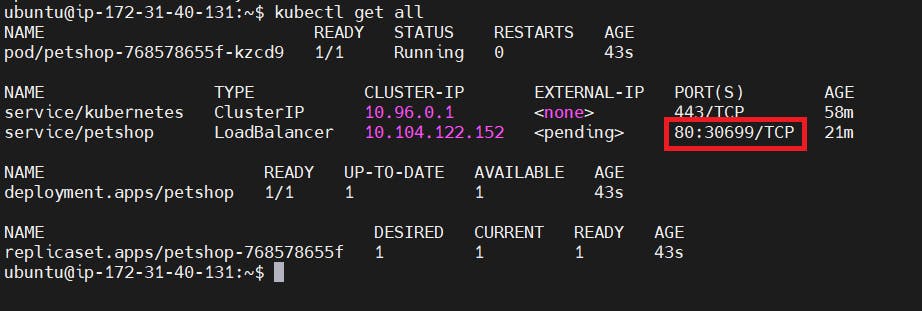
In the Kubernetes cluster(master) give this command
kubectl get all
kubectl get svc
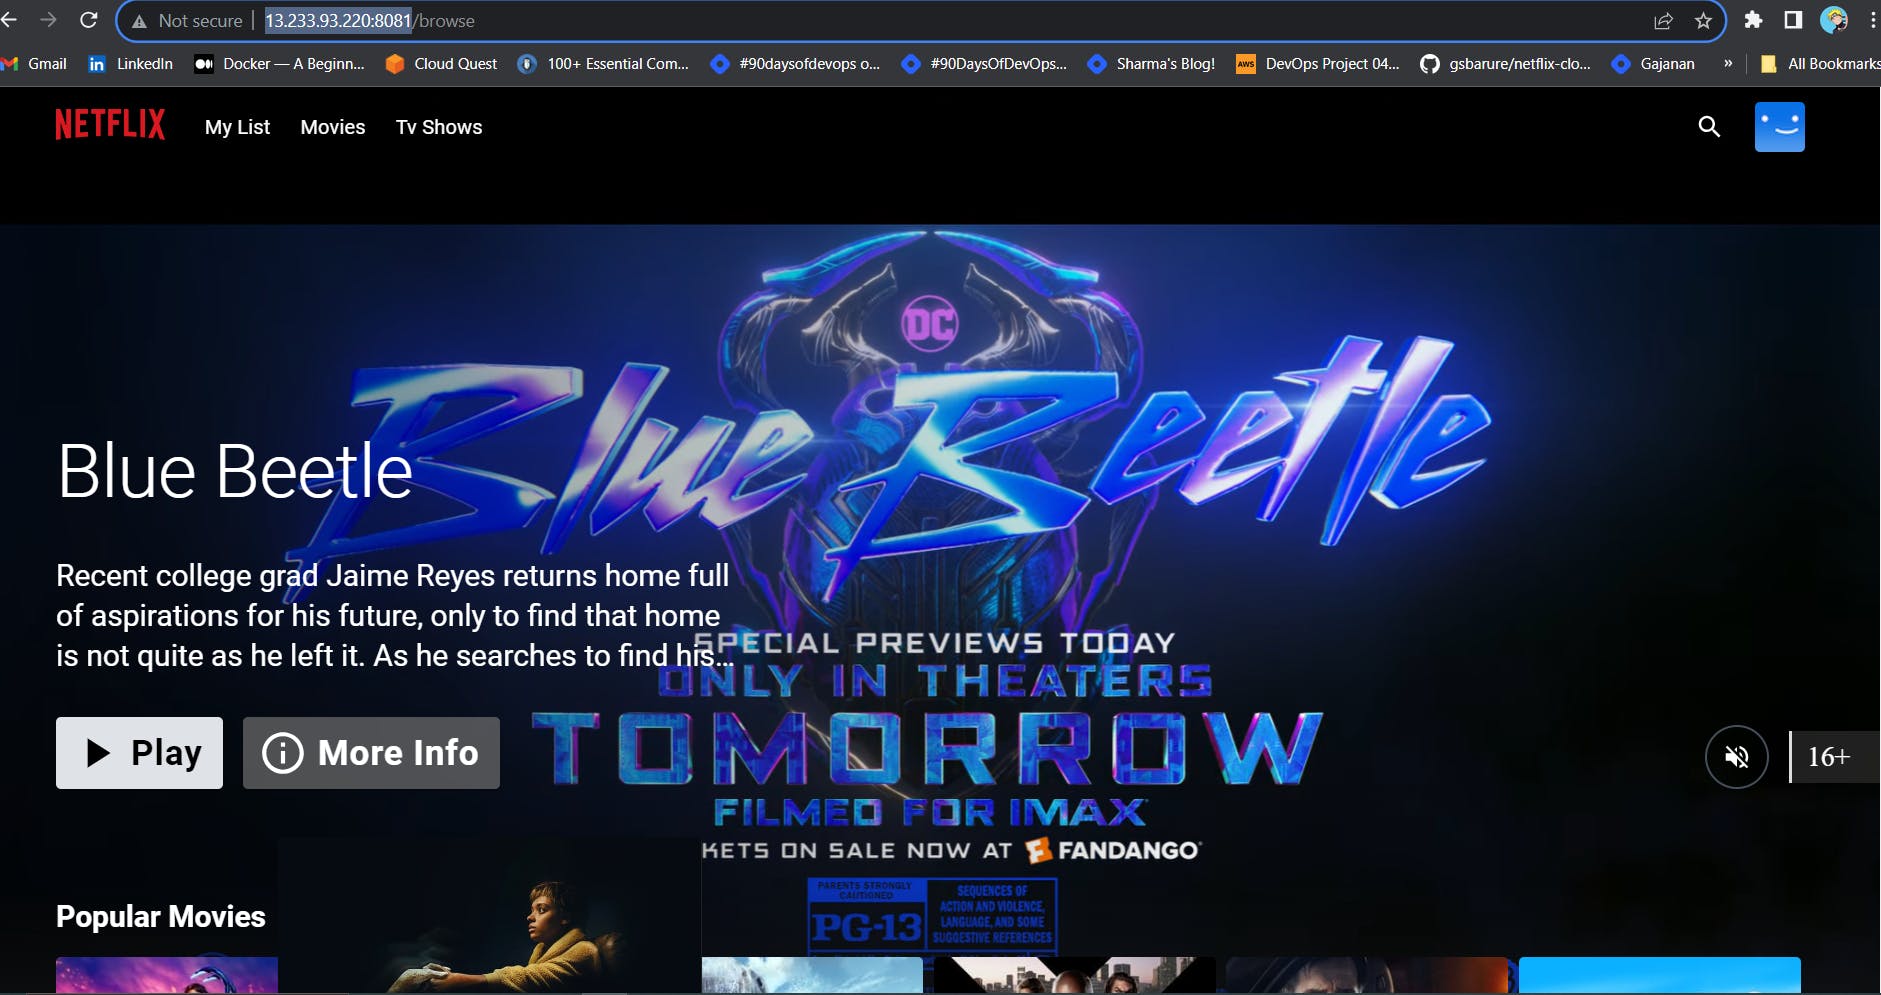
STEP 12:Access from a Web browser with
<public-ip-of-slave:service port>
output:

Monitoring
Step 13: Terminate instances.
Complete Pipeline
pipeline{
    agent any
    tools{
        jdk 'jdk17'
        nodejs 'node16'
    }
    environment {
        SCANNER_HOME=tool 'sonar-scanner'
    }
    stages {
        stage('clean workspace'){
            steps{
                cleanWs()
            }
        }
        stage('Checkout from Git'){
            steps{
                git branch: 'main', url: 'https://github.com/Aj7Ay/Netflix-clone.git'
            }
        }
        stage("Sonarqube Analysis "){
            steps{
                withSonarQubeEnv('sonar-server') {
                    sh ''' $SCANNER_HOME/bin/sonar-scanner -Dsonar.projectName=Netflix \
                    -Dsonar.projectKey=Netflix '''
                }
            }
        }
        stage("quality gate"){
           steps {
                script {
                    waitForQualityGate abortPipeline: false, credentialsId: 'Sonar-token'
                }
            }
        }
        stage('Install Dependencies') {
            steps {
                sh "npm install"
            }
        }
        stage('OWASP FS SCAN') {
            steps {
                dependencyCheck additionalArguments: '--scan ./ --disableYarnAudit --disableNodeAudit', odcInstallation: 'DP-Check'
                dependencyCheckPublisher pattern: '**/dependency-check-report.xml'
            }
        }
        stage('TRIVY FS SCAN') {
            steps {
                sh "trivy fs . > trivyfs.txt"
            }
        }
        stage("Docker Build & Push"){
            steps{
                script{
                   withDockerRegistry(credentialsId: 'docker', toolName: 'docker'){
                       sh "docker build --build-arg TMDB_V3_API_KEY=AJ7AYe14eca3e76864yah319b92 -t netflix ."
                       sh "docker tag netflix sevenajay/netflix:latest "
                       sh "docker push sevenajay/netflix:latest "
                    }
                }
            }
        }
        stage("TRIVY"){
            steps{
                sh "trivy image sevenajay/netflix:latest > trivyimage.txt"
            }
        }
        stage('Deploy to container'){
            steps{
                sh 'docker run -d --name netflix -p 8081:80 sevenajay/netflix:latest'
            }
        }
        stage('Deploy to kubernets'){
            steps{
                script{
                    dir('Kubernetes') {
                        withKubeConfig(caCertificate: '', clusterName: '', contextName: '', credentialsId: 'k8s', namespace: '', restrictKubeConfigAccess: false, serverUrl: '') {
                                sh 'kubectl apply -f deployment.yml'
                                sh 'kubectl apply -f service.yml'
                        }
                    }
                }
            }
        }

    }
    post {
     always {
        emailext attachLog: true,
            subject: "'${currentBuild.result}'",
            body: "Project: ${env.JOB_NAME}
" +
                "Build Number: ${env.BUILD_NUMBER}
" +
                "URL: ${env.BUILD_URL}
",
            to: 'postbox.aj99@gmail.com',
            attachmentsPattern: 'trivyfs.txt,trivyimage.txt'
        }
    }
}
Comments (22)
Hi, This was great. I learned a lot here. Keep up the good work. I found that you were missing the Trivy installation in above. So I used the code below for the installation. wget -qO - https://aquasecurity.github.io/trivy-repo/deb/public.key | gpg --dearmor | sudo tee /usr/share/keyrings/trivy.gpg > /dev/null echo "deb [signed-by=/usr/share/keyrings/trivy.gpg] https://aquasecurity.github.io/trivy-repo/deb $(lsb_release -sc) main" | sudo tee -a /etc/apt/sources.list.d/trivy.list apt-get install trivy trivy --version Regards, Sampath
I will see thaanks for Update
The code is already in blog bro may be you missed it
Thank you for sharing such a good project.
Thank you so much for the End-to-End Pipeline with detailed presentation. One of the best in recent times.
blue bottle image and muzzle image coming your netflix same thing i done that image not getting how to that image coming tell me bro
I didnt get your point brother
Wonderful project I have saw ever. Thanks
First of all thanks for sharing such a wonderfull project. My questions is why pipeline always stucks at sonar quality gate. Can we make it faster. it runs fine without quality gate. but when i add that step pipeline stucks for long time. Thanks
Hey Ajay, thank you for this wonderful project, your documentation was also on point, I am a newbie to Grafana, why while importing the dashboard, why we using number code, what is it?
Thank Ajay for this project
Your article is a great mix of thorough research and personal perspective. Really enjoyed it!
Number code is predefined Dashboard and already existing one and you can also create one
Hi Ajay, First of all, thank you for this wonderful project and document. I have a small doubt or request—could you please create a Robot shopping cart project? I'm asking because you explain each point clearly and provide excellent documentation. It would be great to see a project like this from you. Thank you!
it happened to me too, but when i use the same version of sonar used in the project, it worked and it was faster
You are correct Sampath. Thank you very much for your comment. Was stuck at this. And thank you so much Ajay. Your efforts for sharing knowledge are exceptional.
TMDB website is opening. error : This site can’t be reached www.themoviedb.org took too long to respond.
amazing content brother
kluster is not deploying with this cmd error coming
Use 24.04 setup
Use VPN
the Tmdb website is not working as of now, tried some alternatives but they didnt worked, can you tell something what to do please, without the api key, movies are not loading in the frontend
Leave a comment