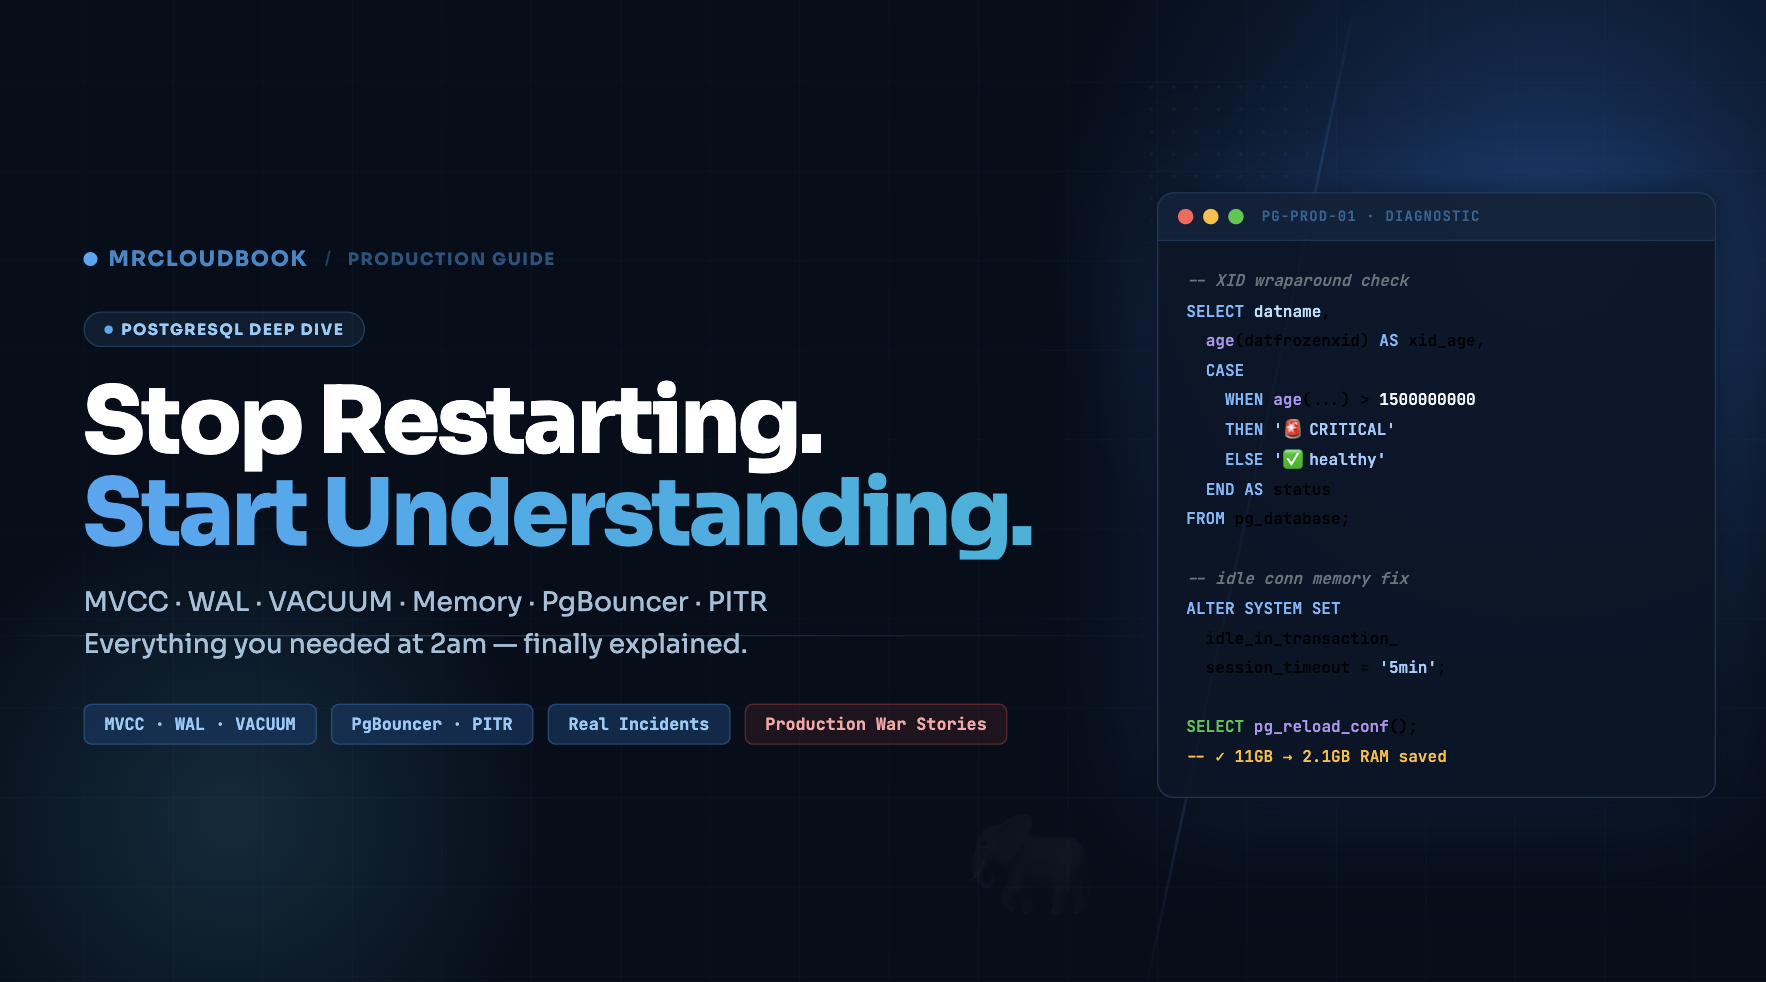
PostgreSQL Deep Dive: Moving Beyond the Restart
I’m going to say the thing that no one in DevOps admits out loud: I managed PostgreSQL databases for over 3 years before I truly understood what PostgreSQL was actually doing. I knew how to install it, configure it from a Stack Overflow checklist, write pg_dump backup scripts, and wire up PgBouncer. And when something broke - when memory spiked, when queries slowed down, when disk filled up - my playbook had one step: restart PostgreSQL and see if it goes away.
And here’s the embarrassing part: it usually worked. A restart cleared the memory bloat. The slow queries went away for a few hours. The disk thing turned out to be WAL files, which also resolved after a restart. So I kept doing it. I got good at restarting PostgreSQL fast. I wrote runbooks about it. I trained junior engineers to restart it in specific situations.
The real crisis came at 2:47am on a Tuesday. Our postgres server was at 98% RAM, queries were queuing up, and the on-call alert was firing. I went to restart PostgreSQL and it wouldn’t come back up cleanly. It kept crashing during startup with a cryptic error about transaction ID age. I had no idea what that meant. I spent 45 minutes reading PostgreSQL documentation I’d never opened before, in the dark, while Slack was pinging. That table had 200 million rows of TimescaleDB time-series data and it took over an hour to recover.
The root cause? Autovacuum had fallen behind on XID freeze work months ago because our PgBouncer had idle_in_transaction_session_timeout set to zero - so a broken app connection had been holding an open transaction for 11 days, blocking all freeze operations. The XID counter had gotten dangerously close to the wraparound threshold. PostgreSQL was doing the right thing by warning us. We just never looked at the warning.
That incident is what made me actually sit down and learn PostgreSQL properly. Not tutorials - the actual source documentation, the internals, the system views, the configuration parameters and what they actually do. This guide is everything I built from that 6-month learning process, organized the way I wish someone had organized it for me. Written for the DevOps engineer who manages PostgreSQL in production and needs to understand it well enough to fix it at 2am - not just restart it.
Architecture & Process Model
Why every connection is an OS process - and what that costs you
PostgreSQL uses a client-server model with a process-per-connection architecture. This is the single most important design decision to understand, because it explains memory usage, connection limits, and why PgBouncer matters so much. Unlike MySQL (which uses threads), PostgreSQL forks a new OS process for every single client connection.
The Fork Model - What Actually Happens
When a client connects to PostgreSQL on port 5432, here is the exact sequence that happens in the OS:
1. postmaster listens on port 5432 (or a Unix socket)
The postmaster is the parent process with PID e.g. 103852. It does nothing but accept connections and fork children. On our postgres server, you can see it with: ps aux | grep postmaster
2. Client sends TCP SYN - postmaster calls fork()
fork() creates an exact copy of the postmaster process. The child inherits the full memory layout of the parent. This is fast but expensive - every forked child starts with ~5-10MB of base memory even before doing anything.
3. Backend process handles auth via pg_hba.conf
The child process (now a “backend”) reads /etc/postgresql/13/main/pg_hba.conf. The first matching rule wins. On our server: host all all 0.0.0.0/0 trust was one of the rules - meaning any IP with any credentials gets in. We’ll fix that later.
4. Backend enters the query loop
Parse → Analyze → Plan → Execute → Return results. The backend sits in this loop until the client disconnects. During this time it holds memory in the OS process address space.
5. Client disconnects → process exits → OS reclaims memory
This is the ONLY way to reclaim memory from a backend. There is no “return memory while staying connected.” The process must die. This is why idle connections holding 350MB are a real problem - you can’t reclaim that RAM without killing the connection.
What You Actually See Running on postgres
When I ran systemctl status postgresql@13-main and ps auxf | grep postgres on our server, here’s what the process tree looked like - and what each process actually does:
postgres  103852  0.0  0.1  227028  28816 ?  Ss   Feb12  postmaster # The parent
postgres  103854  0.0  0.0  227028   8200 ?  Ss   Feb12  \_checkpointer
postgres  103855  0.0  0.0  227028   8196 ?  Ss   Feb12  \_background writer
postgres  103856  0.0  0.0  227028   8196 ?  Ss   Feb12  \_walwriter
postgres  103857  0.0  0.0  227784   9300 ?  Ss   Feb12  \_autovacuum launcher
postgres  103858  0.0  0.0  175532   6520 ?  Ss   Feb12  \_stats collector
postgres  103860  0.0  0.0  227892   8100 ?  Ss   Feb12  \_logical replication launcher
postgres  103859  0.0  0.1  234100  18420 ?  Ss   Feb12  \_TimescaleDB BG Worker Launcher
postgres  103861  0.0  0.2  241200  42300 ?  Ss   Feb12  \_TimescaleDB BG Worker Scheduler
# --- And then the idle connections you saw ---
ajay     104201  0.0  4.2  583148 350120 ?  Ss   11:42  \_postgres: ajay mrcloudbook 10.x.x.x idle  # 350MB!
ajay     104202  0.0  4.1  571248 338240 ?  Ss   11:43  \_postgres: ajay mrcloudbook 10.x.x.x idle  # 338MB!
# ... 23 more like this ...
The key insight here: those “idle” connections are full OS processes. The RSS (resident set size) column shows how much RAM the OS has allocated to each. The backend labeled ajay mrcloudbook 10.x.x.x idle ran a large query with big sorts/joins, PostgreSQL internally freed those buffers, but glibc held onto the OS memory. Every restart of PostgreSQL kills all these processes at once - which is why restarting always freed memory temporarily.
Background Processes - The Full Reference
| Process | What It Actually Does | What Breaks If It Dies |
|---|---|---|
| postmaster | Listens on port 5432, forks backend processes, restarts other background processes if they crash | Everything - it’s the parent of all others |
| checkpointer | Periodically writes ALL dirty pages from shared_buffers to the actual data files on disk. Creates a consistent recovery point. Triggered by max_wal_size or checkpoint_timeout. | WAL files accumulate until restart. Recovery time increases. |
| background writer | Proactively writes dirty pages in small batches between checkpoints. Reduces the burst I/O during checkpoints. | Checkpointer has to do more work, causing bigger I/O spikes |
| WAL writer | Flushes WAL buffers to pg_wal/ files on disk. Runs every wal_writer_delay (200ms default). | Transactions can’t commit - durability guarantee broken |
| autovacuum launcher | CMonitors pg_stat_user_tables every autovacuum_naptime (1min). When dead_tuples threshold is crossed, launches an autovacuum worker. | Dead tuples accumulate. Table bloat. Eventually XID wraparound and database shutdown. |
| autovacuum worker | Temporary process spawned per-table. Scans for dead tuples, removes them, updates the visibility map, freezes old XIDs. Throttled by autovacuum_vacuum_cost_delay. | N/A - each is temporary. If blocked, launcher tries again. |
| stats collector | Collects table/index access counts, row counts, I/O stats. Writes to pg_stat_tmp/. Powers all pg_stat_* views. | pg_stat_* views go stale. Performance monitoring blind. |
| TimescaleDB BG Workers | Two workers: Launcher manages them, Scheduler runs compression jobs, continuous aggregate refreshes, and data retention policies on schedule. | Old data won’t compress. Continuous aggregates go stale. |
The autovacuum launcher silent death
Six months into managing a PostgreSQL server, I noticed our biggest table was getting slower and slower over time. EXPLAIN showed sequential scans where index scans had been happening before. Dead tuples had climbed to 40% of the table. The problem: the autovacuum launcher had silently crashed and wasn’t restarting on one of our servers (a known bug in PG 11 triggered by a specific extension conflict). Because I didn’t know what autovacuum was or that it could crash, I had no monitoring for it.
I discovered this by running: SELECT pid, query FROM pg_stat_activity WHERE query LIKE 'autovacuum:%'; - which returned zero rows when it should have returned 1-3 rows at any given time on a busy server. The fix was restarting PostgreSQL (accidentally correct!) because that restarts all background processes including the launcher. But the real fix would have been adding an alert: if no autovacuum has run on any table for more than 30 minutes, page on-call.
Root Cause & Real Fix Add `log_autovacuum_min_duration = 0` to log all autovacuum activity. Alert if `SELECT count(*) FROM pg_stat_activity WHERE query LIKE 'autovacuum:%'` returns 0 for more than 10 minutes on a server under load. Also: monitor `n_dead_tup` in pg_stat_user_tables for growing dead tuple counts.
Storage, Pages & the TOAST Mechanism
How PostgreSQL physically stores your data on disk - and what happens with large values
Every PostgreSQL table is stored as a collection of 8KB pages on disk. Understanding this page structure explains why queries have the performance characteristics they do, why page cache hit ratio matters, and why VACUUM doesn’t shrink files.
The Physical File Layout
When you create a database and table, PostgreSQL creates actual files on disk. Let’s trace exactly where your data lives on postgres:
-- Find the file path for any table
SELECT pg_relation_filepath('your_table');
-- Returns: base/16384/16385
-- Full path: /var/lib/postgresql/13/main/base/16384/16385

-- The 16384 is your database OID, 16385 is the table's OID
-- Find your database OID:
SELECT oid, datname FROM pg_database WHERE datname = 'mrcloudbook';

-- Find table OID and all related files:
SELECT oid, relname, relfilenode, relpages, reltuples
FROM pg_class WHERE relname = 'your_table';

-- For every table there are up to 3 physical files:
-- base/16384/16385        ← the actual heap (rows)
-- base/16384/16385_fsm    ← free space map (where to insert new rows)
-- base/16384/16385_vm     ← visibility map (which pages are all-visible)

-- If table > 1GB, PostgreSQL splits into segments:
-- base/16384/16385        ← first 1GB
-- base/16384/16385.1      ← next 1GB
-- base/16384/16385.2      ← next 1GB, etc.
The 8KB Page Structure
Every data file is divided into 8192-byte (8KB) pages. When you run a SELECT, PostgreSQL reads entire pages into shared_buffers. This is why even selecting 1 row from a table causes at least 1 full 8KB page to be read. It’s also why row width matters for query performance: a wider row means fewer rows per page means more pages to scan.
What’s Inside a Page
Page Header (24 bytes)- LSN of last WAL change to this page, checksum, free space pointers (pd_lower = end of item pointers, pd_upper = start of free space)Item Pointers (4 bytes each)- Array of offsets pointing to tuples. Grows downward from the top of the data area. Each 4-byte pointer = (offset, length) to a tuple below.Free Space- The gap between item pointers (growing down) and tuples (growing up). When they meet, the page is full. VACUUM marks dead tuple space as free here.Tuples (rows)- The actual row data, growing upward from the bottom of the page. Each tuple has a 23-byte header (xmin, xmax, ctid, infomask) followed by column data.
The Tuple Header - What Powers MVCC
Every row has a 23-byte header before its actual column data. This header is how MVCC works - it contains the transaction IDs that created and deleted each row version:
-- Install pageinspect to peek inside pages (safe, read-only)
CREATE EXTENSION pageinspect;

-- See every tuple on page 0 of a table
SELECT t_xmin, t_xmax, t_ctid, t_infomask
FROM heap_page_items(get_raw_page('users', 0));

-- Output shows:
-- t_xmin  | t_xmax  | t_ctid  | t_infomask
-- 100     | 0       | (0,1)   | 2304       ← live row, created by txn 100
-- 100     | 200     | (0,3)   | 1280       ← dead row (updated by txn 200)
-- 200     | 0       | (0,3)   | 2304       ← new version from txn 200

-- t_xmax = 0 means "not deleted"
-- t_ctid pointing to itself = the current (latest) version
-- t_ctid pointing elsewhere = there's a newer version on another page
TOAST - Why You Can Store Gigabyte Values in PostgreSQL
PostgreSQL pages are 8KB. But you can store text fields with megabytes of data. How? TOAST - The Oversized-Attribute Storage Technique. When a row would exceed roughly 2KB per field, PostgreSQL automatically compresses and/or moves the value to a separate TOAST table.
-- Every table with large columns has a hidden TOAST table
SELECT relname, reltoastrelid,
       pg_size_pretty(pg_relation_size(reltoastrelid)) AS toast_size
FROM pg_class
WHERE relname = 'events' AND reltoastrelid != 0;

-- See TOAST strategy per column:
SELECT attname, atttypid::regtype,
       CASE attstorage
         WHEN 'p' THEN 'PLAIN (never TOAST)'
         WHEN 'e' THEN 'EXTENDED (compress then TOAST)'
         WHEN 'x' THEN 'EXTERNAL (TOAST without compress)'
         WHEN 'm' THEN 'MAIN (compress, prefer main table)'
       END AS storage_strategy
FROM pg_attribute
WHERE attrelid = 'events'::regclass AND attnum > 0;

-- For already-compressed data (e.g., images stored as bytea),
-- use EXTERNAL to avoid double-compression wasting CPU:
ALTER TABLE documents ALTER COLUMN content SET STORAGE EXTERNAL;
⚠️ The TOAST Performance Trap TOAST lookups require an additional heap fetch from the TOAST table. If you're doing `SELECT *` on a table with large JSONB columns and only actually using a few fields, you're pulling potentially megabytes of TOAST data per row. Use `SELECT id, name, created_at` instead of `SELECT *` on tables with large JSONB/text columns. On our events table with ~500KB JSON payloads per row, this was a 50× I/O difference.
Memory Architecture
Why 25 idle connections can eat 10GB of RAM - and the glibc malloc problem nobody talks about
Memory in PostgreSQL splits into two fundamentally different pools: shared memory (one pool, visible to all backend processes) and per-backend private memory (separate for each connection). Getting this wrong is how you end up with a server that consumes 10GB of RAM for 25 idle connections that are doing absolutely nothing.
Shared Memory - What Everyone Shares
| Component | Our Setting | What It Stores | What Happens When Full |
|---|---|---|---|
| shared_buffers | 2GB | 8KB data pages cached from disk - the main database cache. All reads/writes go through here first. | LRU-like eviction (CLOCK-SWEEP). Old pages evicted to make room. Cache miss = disk read = slow. |
| WAL buffers | auto (~1/32 of shared_buffers) | WAL records waiting to be flushed to pg_wal/ files. Ring buffer. | WAL writer flushes synchronously. Never truly “full” - blocks until flush completes. |
| Lock table | max_locks_per_transaction × max_connections | All current locks across all backends. Shared so backends can see each other’s locks. | ERROR: out of shared memory. Requires restart to expand. |
| CLOG buffers | auto (~256KB) | Transaction commit status: committed, aborted, in-progress. Used for MVCC visibility checks. | Evicted to pg_xact/ files on disk. Slows visibility checks if not cached. |
| Proc array | max_connections sized | Array of all running backend PIDs, their transaction IDs, query start times. Powers pg_stat_activity. | Fixed size. If max_connections is hit, new connections rejected. |
Per-Backend Private Memory - Where the Problem Lives
Each backend process (each connection) has its own private heap. This is where work_mem, maintenance_work_mem, sort buffers, and hash tables live. The critical thing to understand: work_mem is per operation, not per query, not per connection.
-- This ONE query can use 5× work_mem:
SELECT a.*, b.*, c.total
FROM users a
JOIN orders b ON a.id = b.user_id        -- hash join → 1× work_mem
JOIN (
  SELECT user_id, sum(amount) AS total
  FROM orders GROUP BY user_id            -- hash aggregate → 1× work_mem
) c ON a.id = c.user_id
ORDER BY a.created_at,                    -- sort → 1× work_mem
         b.amount DESC,                   -- another sort → 1× work_mem
         c.total DESC                     -- another sort → 1× work_mem
LIMIT 1000;

-- Total memory this query could use: 5 × 8MB = 40MB per connection
-- With 25 connections all running this query: 25 × 40MB = 1GB just for work_mem!
-- If work_mem were 64MB: 25 × 5 × 64MB = 8GB just for work_mem!
The glibc Malloc Problem - Why “Idle” Means 350MB
The glibc Malloc Problem - Why “Idle” Means 350MB
This is the thing that confused me for years. Here’s exactly what happens:
t=0: Connection opens
OS allocates ~5-10MB to the backend process
Base overhead: catalog cache, plan cache, connection state. RSS = ~10MB.
t=60s: Application runs large analytical query
Hash joins + sorts allocate ~340MB via malloc()
PostgreSQL calls malloc() which calls brk()/sbrk() to grow the heap. The OS moves the heap pointer up. RSS jumps to ~350MB.
t=65s: Query finishes
PostgreSQL calls pfree() / free(). Internally, the memory is “free”.
But glibc’s malloc implementation does NOT call brk() to shrink the heap back down. It marks those pages as “free” in its own internal bookkeeping, but keeps them reserved in the process’s virtual address space.
t=66s-forever: Connection sits idle
OS still shows 350MB RSS for this process
The heap can only shrink if the TOP of the heap is free. Due to heap fragmentation - even one small allocation sitting at the top keeps everything below it “reserved.” This is called heap fragmentation. You can verify this with: cat /proc/
Fix option 1: Kill the connection
Process exits → OS reclaims all memory immediately
This is what restarting PostgreSQL did. All 25 backend processes die, OS reclaims their memory. Fast but disruptive. The real fix: don’t let connections sit idle long enough for this to matter.
Fix option 2: jemalloc (permanent fix)
jemalloc aggressively returns memory to OS after free()
jemalloc uses a different allocation strategy with arenas and thread caches. It calls madvise(MADV_DONTNEED) after freeing large blocks, telling the OS it can reclaim those pages. RSS drops after each query. No restart needed.
# Install jemalloc
apt install libjemalloc2
dpkg -L libjemalloc2  # find the .so path, typically:
# /usr/lib/x86_64-linux-gnu/libjemalloc.so.2

# Add to PostgreSQL environment file
# /etc/postgresql/13/main/environment
echo "LD_PRELOAD='/usr/lib/x86_64-linux-gnu/libjemalloc.so.2'" >> /etc/postgresql/13/main/environment

# Restart PostgreSQL to apply
systemctl restart postgresql@13-main

# Verify it loaded (check any backend process)
cat /proc/$(pgrep -f "postgres: .* idle" | head -1)/maps | grep jemalloc
# Should show: /usr/lib/x86_64-linux-gnu/libjemalloc.so.2

# Now run a big query and watch memory drop after it finishes:
watch -n1 "ps aux | grep 'postgres:' | awk '{print \$6}' | paste -sd+ | bc"
The Complete Memory Budget for postgres

✅ What Healthy Memory Looks Like With jemalloc installed AND all connections going through PgBouncer (transaction mode, 5-10 actual PG connections), idle memory should be: 2GB shared_buffers + 10 × ~15MB active connections = ~2.15GB. That's a 5× reduction from our observed 11GB, without changing any workload.
MVCC - Multi-Version Concurrency Control
The most important concept in PostgreSQL - how read and write operations never block each other
Readers never block writers. Writers never block readers. This is the MVCC guarantee - and it comes with a maintenance cost called dead tuples.
MySQL (with InnoDB) also uses MVCC, but PostgreSQL’s implementation is different in a key way: PostgreSQL stores old row versions in the same heap as the main data, while MySQL stores them in a separate undo log. This means PostgreSQL’s MVCC leaves “dead tuples” scattered through your tables that must be cleaned up by VACUUM.
How Every Write Operation Works Under MVCC
-- ═══ INSERT ═══════════════════════════════════════════════════
BEGIN;  -- Transaction ID assigned: 1001
INSERT INTO users (id, name) VALUES (1, 'Alice');
COMMIT;
-- Page now contains:
-- [xmin=1001, xmax=0,    ctid=(0,1), name='Alice'] ← live

-- ═══ UPDATE ═══════════════════════════════════════════════════
BEGIN;  -- Transaction ID: 1002
UPDATE users SET name = 'Alice B.' WHERE id = 1;
COMMIT;
-- Page now contains TWO versions:
-- [xmin=1001, xmax=1002, ctid=(0,2), name='Alice'  ] ← DEAD (xmax set)
-- [xmin=1002, xmax=0,    ctid=(0,2), name='Alice B.'] ← LIVE
-- NOTICE: The old row is NOT physically removed. It's "dead" but still there.
-- VACUUM will clean it up later. Until then, it's wasting space.

-- ═══ DELETE ═══════════════════════════════════════════════════
BEGIN;  -- Transaction ID: 1003
DELETE FROM users WHERE id = 1;
COMMIT;
-- Page now contains:
-- [xmin=1002, xmax=1003, ctid=(0,2), name='Alice B.'] ← DEAD
-- The file does not shrink. Space is reclaimed only by VACUUM.

-- ═══ VERIFY THIS YOURSELF ═════════════════════════════════════
-- Create table, insert, update, and check dead tuple count:
SELECT n_live_tup, n_dead_tup
FROM pg_stat_user_tables
WHERE relname = 'users';
-- Run updates in a loop, watch n_dead_tup climb
-- Then run: VACUUM VERBOSE users; and watch it drop back to 0
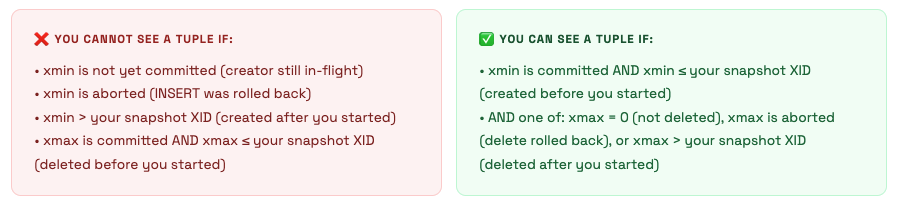
Visibility Rules - How PostgreSQL Decides What You Can See
When your transaction runs a SELECT, PostgreSQL checks every tuple it encounters against its snapshot. A snapshot is a set of information captured at the start of the transaction (REPEATABLE READ) or each statement (READ COMMITTED): which transactions are committed, which are in-progress, which are aborted.
Transaction ID Wraparound - The Silent Killer That Took Down Our Server
Transaction IDs are 32-bit unsigned integers. There are ~4.2 billion of them. PostgreSQL uses modular arithmetic - it considers XIDs within ~2 billion of the current XID as “in the past” (visible) and everything else as “in the future” (invisible). When enough transactions have occurred that old, unfrozen XIDs are about to cross the 2 billion boundary, PostgreSQL must intervene or committed data becomes invisible.
The solution is VACUUM FREEZE - it marks old tuples as “frozen” (a special sentinel value meaning “visible to all transactions forever”). Autovacuum does this automatically when a table’s oldest XID approaches the autovacuum_freeze_max_age threshold (default 200 million). But if autovacuum is blocked by long-running transactions, this can’t happen.
XID Wraparound - What Actually Happened
Here’s the detailed timeline of what caused our production incident. An app bug was holding a database connection open with an idle-in-transaction state for 11 days. This means it had opened a transaction with BEGIN and never committed or rolled back. In PostgreSQL, a transaction that’s been open for 11 days causes:
- its XID is “in-flight” - autovacuum cannot freeze any tuple that’s newer than this XID;
- the “oldest XID that must remain visible” (relfrozenxid) cannot advance past this point; - - VACUUM FREEZE runs but cannot freeze tuples, because they might still be “needed” by the 11-day-old transaction.
After 11 days of no freezing, plus the existing XID age, the database age hit 1.6 billion. PostgreSQL logged WARNING: database "mrcloudbook" must be vacuumed within 600000000 transactions - which we weren’t monitoring. At 1.8 billion, PostgreSQL entered emergency autovacuum mode and started running aggressive freeze vacuums constantly, causing severe I/O load. The queries slowing down were the symptom - the cause was VACUUM fighting for I/O resources.
The connection holding the 11-day transaction was from a broken deployment where the app had crashed but the database connection was kept alive by the TCP keepalive settings. The app wasn’t sending queries - but it had begun a transaction and PostgreSQL was legally obligated to keep it “open.”
The Fix (all three layers) Immediate: `SELECT pg_terminate_backend(pid) FROM pg_stat_activity WHERE xact_start < now() - interval '1 hour';` - killed the long-running transaction. VACUUM FREEZE could now run. Short-term: `VACUUM FREEZE VERBOSE mrcloudbook_events;` - manually force-froze the biggest tables. Permanent: Added `idle_in_transaction_session_timeout = 300` (5 minutes) to postgresql.conf. Now any connection that opens a transaction and goes idle for 5 minutes is automatically killed.
-- ═══ CLUSTER-LEVEL XID AGE ════════════════════════════════════
SELECT datname,
       age(datfrozenxid) AS xid_age,
       2000000000 - age(datfrozenxid) AS transactions_until_shutdown,
       CASE
         WHEN age(datfrozenxid) > 1500000000 THEN '🚨 CRITICAL - act now'
         WHEN age(datfrozenxid) > 1000000000 THEN '⚠️ WARNING - schedule vacuum'
         WHEN age(datfrozenxid) > 500000000  THEN '👀 WATCH - autovacuum running?'
         ELSE '✅ healthy'
       END AS status
FROM pg_database
ORDER BY age(datfrozenxid) DESC;

-- ═══ TABLE-LEVEL XID AGE (find the laggards) ═════════════════
SELECT relname,
       age(relfrozenxid) AS xid_age,
       pg_size_pretty(pg_total_relation_size(oid)) AS size,
       last_autovacuum,
       last_autoanalyze
FROM pg_class
WHERE relkind = 'r' AND age(relfrozenxid) > 100000000
ORDER BY age(relfrozenxid) DESC;

-- ═══ FIND WHAT'S BLOCKING VACUUM FREEZE ══════════════════════
SELECT pid,
       usename,
       datname,
       state,
       now() - xact_start AS txn_age,
       now() - query_start AS query_age,
       wait_event_type,
       wait_event,
       left(query, 200) AS query
FROM pg_stat_activity
WHERE xact_start IS NOT NULL
  AND now() - xact_start > interval '1 hour'
ORDER BY xact_start;
-- Any result here is a potential blocker for autovacuum freeze
-- Long idle-in-transaction rows = kill them with pg_terminate_backend(pid)
WAL - Write-Ahead Logging in Depth
How PostgreSQL guarantees durability, what a checkpoint costs, and why your WAL directory fills up
Every change is written to WAL before it's written to data files. The data files are eventually consistent. WAL is always consistent. This asymmetry is what allows crash recovery, replication, and PITR.
The Exact Write Path for a Single UPDATE
Let’s trace exactly what happens when your application executes a single UPDATE on our postgres server:
App sends:  UPDATE events SET status='processed' WHERE id=12345;

Step 1 - Find the page:
  Backend checks shared_buffers for block containing row id=12345.
  Cache HIT  → found, cost: ~1 CPU operation (nanoseconds)
  Cache MISS → disk read required, load into shared_buffers (microseconds-milliseconds)

Step 2 - Write WAL record to WAL buffer (in shared memory):
  WAL record format for UPDATE:
  [LSN] [txn_id] [relation_oid] [block_num] [offset] [old_data] [new_data]
  This record is ~100-200 bytes.
  Cost: ~1 CPU operation. The WAL buffer is a ring buffer, writes are sequential.

Step 3 - Apply change to shared_buffers:
  Old tuple: mark xmax = current_txn_id (logically delete)
  New tuple: insert with xmin = current_txn_id
  Mark page as DIRTY (not yet written to disk data file)
  Cost: ~1 CPU operation. Memory-only, very fast.

Step 4 - Return success to application:
  If synchronous_commit = on (default): wait for WAL writer to flush WAL buffer to disk.
  If synchronous_commit = off: return immediately without waiting for disk flush.
  The application gets its COMMIT acknowledgment here.

Step 5 - WAL writer flushes (async background, or sync on commit):
  Calls fsync() on pg_wal/ file segment.
  Duration: depends on disk. NVMe: ~0.1ms. SSD: ~0.5ms. HDD: ~5ms.
  This is often the bottleneck for write-heavy workloads on spinning disks.

Step 6 - Checkpointer eventually writes data file (minutes later):
  Checkpointer scans shared_buffers for dirty pages.
  Writes each dirty page to its data file using write() + fsync().
  This does NOT happen on every transaction - only during checkpoints.
Checkpoints - The Full Picture
A checkpoint is the most expensive regular operation PostgreSQL does. It writes every dirty page from shared_buffers to disk. With 2GB shared_buffers and pages dirtied by writes, a checkpoint might need to write hundreds of megabytes to disk. This causes the I/O spikes you see every few minutes.
-- Check checkpoint frequency and write stats (from pg_stat_bgwriter)
SELECT
  checkpoints_timed,           -- triggered by checkpoint_timeout
  checkpoints_req,             -- triggered by max_wal_size (bad - means WAL is filling up too fast)
  checkpoint_write_time / 1000.0 AS write_seconds,
  checkpoint_sync_time / 1000.0 AS sync_seconds,
  buffers_checkpoint,          -- pages written by checkpointer
  buffers_clean,               -- pages written by background writer
  buffers_backend,             -- pages written by backends directly (BAD - means checkpoint can't keep up)
  buffers_alloc,               -- new buffers allocated
  now() - stats_reset AS stats_age
FROM pg_stat_bgwriter;

-- If checkpoints_req is high (>10% of total), your max_wal_size is too low
-- If buffers_backend is high, PostgreSQL is stalling queries to write dirty pages
-- Both indicate you should increase max_wal_size and checkpoint_timeout

-- Also: enable checkpoint logging to see them in the log:
-- log_checkpoints = on in postgresql.conf
-- You'll see: LOG: checkpoint complete: wrote 2841 buffers (10.8%), ...
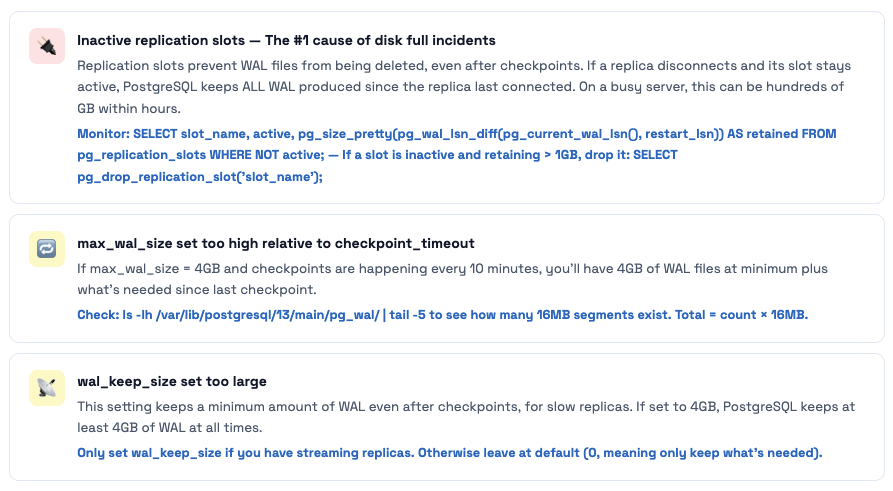
Why Your pg_wal Directory Can Fill Up the Disk
WAL files in /var/lib/postgresql/13/main/pg_wal/ are each 16MB. PostgreSQL keeps WAL files that are needed for: recovery (since last checkpoint), streaming replicas to catch up, and replication slots. Three things cause pg_wal to grow unboundedly:
Query Lifecycle & Mastering EXPLAIN
From SQL string to rows on screen - and how to read EXPLAIN output like an expert
Every query goes through five stages. Understanding each stage tells you where to look when a query is slow: bad statistics = planner stage, bad index = executor stage, permission error = analyzer stage, and so on.
The Planner - Where Most Performance Problems Are Born
The planner’s job is to choose the cheapest execution plan from hundreds of possibilities. It uses statistics (from ANALYZE) to estimate how many rows each operation will produce. When statistics are stale or missing, the planner makes bad decisions - and those bad decisions show up as slow queries.
-- ═══ STEP 1: Run EXPLAIN ANALYZE to see the actual plan ═════
EXPLAIN (ANALYZE, BUFFERS, COSTS, TIMING, FORMAT TEXT)
SELECT e.*, u.name
FROM events e
JOIN users u ON e.user_id = u.id
WHERE e.created_at > now() - interval '1 day'
  AND e.status = 'pending';

-- ═══ WHAT TO LOOK FOR IN THE OUTPUT ══════════════════════════

-- 1. ESTIMATE vs ACTUAL ROWS mismatch → bad statistics
--    rows=1 (estimate) vs rows=50000 (actual) = planner was wildly wrong
--    Fix: ANALYZE events; or increase statistics target

-- 2. HIGH buffers: shared read= → cache misses → disk I/O
--    Buffers: shared hit=12 read=8442 → 8442 pages read from disk
--    8442 × 8KB = 66MB read from disk for one query
--    Fix: add index, or increase shared_buffers if table fits in RAM

-- 3. Seq Scan on large table → probably missing index
--    Seq Scan on events (cost=0..98432 rows=2000000...) → reading 2M rows
--    Fix: CREATE INDEX idx_events_status_created ON events(status, created_at)
--         WHERE status = 'pending'; (partial index, much smaller)

-- 4. Hash Join with high loops= → nested loop gone wrong
--    Nested Loop (actual loops=50000) → inner query ran 50000 times
--    Fix: SET enable_nestloop = off; and re-run EXPLAIN to see alternative

-- 5. Sort with external disk spill (work_mem too low)
--    Sort Method: external merge  Disk: 24576kB → sorting spilled to disk!
--    Fix: SET work_mem = '64MB'; for this session, or increase globally

-- ═══ FIX BAD STATISTICS ═══════════════════════════════════════
-- Check current statistics for a problematic column:
SELECT attname, n_distinct, correlation, null_frac,
       most_common_vals, most_common_freqs
FROM pg_stats
WHERE tablename = 'events' AND attname = 'status';

-- If n_distinct is wrong or histogram_bounds is thin, increase statistics target:
ALTER TABLE events ALTER COLUMN status SET STATISTICS 500;  -- default is 100
ANALYZE events;  -- recompute statistics with higher resolution
Join Strategies - Why Your Query Chose a Hash Join vs Nested Loop
| Join Type | Algorithm | Best When | Weakness |
|---|---|---|---|
| Nested Loop | For each outer row, scan (or index-lookup) inner table | Small outer set, indexed inner lookup (e.g., 10 users × user ID index lookup) | Terrible for large outer sets without an index on the inner table |
| Hash Join | Build hash table from smaller table, probe with larger table | Equality joins on large tables without useful indexes | Needs work_mem for the hash table. Spills to disk if too small. |
| Merge Join | Sort both inputs, walk through them together | Already sorted data (index-based), range conditions, large tables | Requires sorting unless data is pre-sorted via index |
💡 The "disable" trick for debugging plans When a query is slow and you want to see what alternative plans look like: **SET enable_hashjoin = off;** then run EXPLAIN. PostgreSQL will be forced to use a different join strategy. This tells you if the current strategy is actually better or if the planner just had wrong estimates. Always reset after: **SET enable_hashjoin = on;** - never leave these disabled in production.
Indexes Deep Dive - All Types with Real Examples
When to use B-Tree vs GIN vs BRIN - and the index mistakes that killed our query performance
PostgreSQL has 6 index types. The default (B-Tree) is correct for ~85% of cases. For the other 15% - especially with TimescaleDB time-series data, JSONB payloads, and full-text search - using the wrong index type means either no index being used at all, or a multi-gigabyte index when a 24KB one would work better.
B-Tree Index - The Workhorse
-- ═══ MULTI-COLUMN INDEX: ORDER MATTERS ════════════════════════
CREATE INDEX idx_events_status_time ON events(status, created_at);

-- This index supports (leftmost prefix rule):
WHERE status = 'pending'                         -- ✅ uses index
WHERE status = 'pending' AND created_at > now()-'1d' -- ✅ uses both columns
WHERE created_at > now() - interval '1 day'      -- ❌ skips leftmost column → seq scan
ORDER BY status, created_at                       -- ✅ covers sort
ORDER BY status ASC, created_at DESC              -- ❌ mixed directions (create separate index)

-- ═══ COVERING INDEX: ELIMINATE HEAP FETCHES ══════════════════
-- Problem: even with an index on email, fetching 'name' requires heap access
SELECT name FROM users WHERE email = 'alice@example.com';
-- Plan: Index Scan on idx_email → Heap Fetch for name column → slow

-- Solution: covering index with INCLUDE
CREATE INDEX idx_email_cover ON users(email) INCLUDE (name, id, created_at);
-- Plan: Index Only Scan → no heap access → fast!
-- INCLUDE columns are not part of the B-tree key, just stored in leaf pages
-- They don't affect sort order but allow index-only scans for those columns

-- ═══ PARTIAL INDEX: INDEX ONLY WHAT MATTERS ══════════════════
-- If 95% of rows have status='processed', indexing them all is wasteful
CREATE INDEX idx_events_pending ON events(created_at)
  WHERE status = 'pending';
-- This index only contains 'pending' rows → much smaller → much faster
-- But only used when your WHERE clause includes: AND status = 'pending'

-- Check index sizes to understand the win:
SELECT indexrelname,
       pg_size_pretty(pg_relation_size(indexrelid)) AS size,
       idx_scan, idx_tup_read
FROM pg_stat_user_indexes
WHERE relname = 'events'
ORDER BY pg_relation_size(indexrelid) DESC;
BRIN for TimescaleDB - The Index That’s 9000× Smaller
-- Context: Our TimescaleDB hypertable 'metrics' has 50M rows, ~4GB on disk
-- A B-Tree index on 'time' would be ~850MB
-- A BRIN index on 'time' is ~24KB (35000× smaller)

CREATE INDEX idx_metrics_time_brin ON metrics USING BRIN (time);

-- How BRIN works for naturally ordered time-series data:
-- Physical block range 1 (pages 0-127):    min=2024-01-01, max=2024-01-03
-- Physical block range 2 (pages 128-255):  min=2024-01-03, max=2024-01-07
-- Physical block range 3 (pages 256-383):  min=2024-01-07, max=2024-01-12
-- ...hundreds more ranges...

-- Query: WHERE time > '2024-06-01'
-- BRIN checks: which block ranges might contain time > '2024-06-01'?
-- Skip all ranges where max < '2024-06-01' → skip 90% of table!

-- BRIN is only effective when data is PHYSICALLY correlated with the column
-- Time-series with append-only inserts = perfect (rows are physically ordered by time)
-- A 'user_id' column where users insert randomly = BRIN is useless

-- Check correlation (1.0 = perfect, 0 = random):
SELECT attname, correlation
FROM pg_stats
WHERE tablename = 'metrics'
ORDER BY abs(correlation) DESC;
-- time column: correlation = 0.99 → perfect for BRIN
-- user_id:     correlation = 0.02 → useless for BRIN, use B-Tree
GIN for JSONB - The index Our Events Table Needed
-- Our events table has a 'data' JSONB column with event payloads
-- Query: find all events where data contains a specific type
SELECT * FROM events WHERE data @> '{"type": "purchase"}';

-- Without index: Seq Scan on events → reads 50M rows → 30 seconds
-- With GIN index:
CREATE INDEX idx_events_data_gin ON events USING GIN (data);
-- → Bitmap Index Scan on idx_events_data_gin → 0.8ms for same query

-- GIN creates an inverted index: term → list of row pointers
-- "type"     → [(0,1), (0,5), (2,3), ...]
-- "purchase" → [(0,1), (1,2), (5,7), ...]
-- "click"    → [(0,2), (0,4), ...]

-- If you only ever query one top-level key, a targeted B-Tree is smaller and faster:
CREATE INDEX idx_events_type ON events ((data->>'type'));
-- Only indexes the 'type' field. Much smaller than full GIN. Use if 'type' is the main filter.

-- GIN maintenance note: GIN has higher write overhead than B-Tree
-- For write-heavy tables, tune: SET gin_pending_list_limit = '32MB';
-- This batches GIN updates (pending list) and applies them together
The index that made writes 10× slower
We had a table that was being written to thousands of times per second (event ingestion). Someone added 7 indexes to help various dashboard queries. Each index was valid on its own. But every INSERT into the table now had to maintain all 7 indexes. Write throughput dropped from 8,000 inserts/sec to 800 inserts/sec overnight.
The fix wasn’t removing all indexes - it was understanding which ones were actually being used. We found 3 indexes with idx_scan = 0 (never used) and dropped them. We consolidated two redundant single-column indexes into one multi-column covering index. Write throughput recovered to 6,500 inserts/sec.
The Query to Run Weekly `SELECT indexrelname, relname, idx_scan, pg_size_pretty(pg_relation_size(indexrelid)) FROM pg_stat_user_indexes WHERE idx_scan = 0 AND schemaname = 'public' ORDER BY pg_relation_size(indexrelid) DESC;` - Any index with idx_scan = 0 that's been running in production for more than a week is a candidate for removal. Dropping unused indexes speeds up writes and reduces bloat from dead index entries.
VACUUM & Autovacuum - The Maintenance Engine
Why tables bloat, how autovacuum works, and when it’s not keeping up
If you understand MVCC, you understand why VACUUM exists: every UPDATE and DELETE creates a dead tuple that must eventually be cleaned up. Without vacuum, your tables grow unboundedly, your indexes accumulate dead entries, and eventually transaction IDs wrap around and the database refuses to start.
What VACUUM Actually Does - Step by Step
Scan heap pages for dead tuples
Checks each tuple’s xmax against the oldest active transaction. If all active transactions can no longer see the old version, it’s safe to reclaim.
Remove dead entries from all indexes
For each dead tuple, find and remove its entry from every index on the table. This is the expensive part for tables with many indexes - it must scan each index.
Mark freed space in the Free Space Map (FSM)
The space where dead tuples were is now marked as available for new rows. Future INSERTs will reuse this space. Note: the file does NOT shrink. VACUUM reclaims space internally, not at the OS level.
Update the Visibility Map (VM)
If ALL tuples on a page are visible to ALL transactions, mark that page in the visibility map as “all-visible.” This enables Index Only Scans (skipping heap fetches) and speeds up future VACUUMs.
Freeze old tuples (prevent XID wraparound)
Tuples whose xmin is old enough get their xmin replaced with FrozenTransactionId - a special value that’s always considered “in the past” by all transactions. This is how wraparound is prevented.
Update pg_class stats (reltuples, relpages)
Updates the row count and page count estimates in pg_class. The planner uses these for cost estimation.
The Autovacuum Trigger Formula - And Why It Fails Large Tables
Trigger Formula
vacuum_threshold = autovacuum_vacuum_threshold + autovacuum_vacuum_scale_factor × n_live_tup
Default values: threshold=50, scale_factor=0.2 (20%)
- 10,000 row table: vacuum triggers at 50 + 0.2×10000 =
2,050 dead tuples - 1,000,000 row table: vacuum triggers at 50 + 0.2×1M =
200,050 dead tuples - 50,000,000 row table: vacuum triggers at 50 + 0.2×50M =
10,000,050 dead tuples
For large tables, 20% dead means massive bloat before vacuum even starts. Our TimescaleDB event table with 50M rows would need 10 million dead tuples before autovacuum kicked in. That’s 10 million × ~100 bytes = ~1GB of wasted space before any cleanup.
-- ═══ FIND TABLES WITH BLOAT PROBLEMS ════════════════════════
SELECT
  schemaname,
  relname,
  n_live_tup,
  n_dead_tup,
  round(n_dead_tup::numeric / NULLIF(n_live_tup + n_dead_tup, 0) * 100, 1) AS dead_pct,
  last_autovacuum,
  last_autoanalyze,
  pg_size_pretty(pg_total_relation_size(relid)) AS total_size,
  CASE
    WHEN n_dead_tup > n_live_tup * 0.2 THEN '🚨 NEEDS VACUUM NOW'
    WHEN n_dead_tup > n_live_tup * 0.1 THEN '⚠️ Autovacuum should run soon'
    ELSE '✅ OK'
  END AS vacuum_status
FROM pg_stat_user_tables
ORDER BY n_dead_tup DESC
LIMIT 20;

-- ═══ IS AUTOVACUUM CURRENTLY RUNNING? ════════════════════════
SELECT pid,
       now() - query_start AS running_for,
       left(query, 200) AS autovacuum_target
FROM pg_stat_activity
WHERE query LIKE 'autovacuum:%';
-- Expected: 1-3 rows on a busy server
-- 0 rows on a busy server = autovacuum isn't running = problem!

-- ═══ TUNE AUTOVACUUM PER-TABLE FOR LARGE TABLES ═════════════
ALTER TABLE events SET (
  autovacuum_vacuum_scale_factor = 0.01,    -- trigger at 1% dead, not 20%
  autovacuum_vacuum_threshold = 1000,        -- minimum 1000 dead tuples
  autovacuum_vacuum_cost_delay = 0,          -- no throttling for this table
  autovacuum_analyze_scale_factor = 0.005   -- analyze at 0.5% changed rows
);

-- ═══ MANUALLY RUN VACUUM (when autovacuum is too slow) ═══════
-- Regular vacuum (online, no lock):
VACUUM VERBOSE ANALYZE events;

-- Force freeze (for XID wraparound danger):
VACUUM FREEZE VERBOSE events;

-- See what vacuum is doing in real time:
SELECT pid, phase, heap_blks_total, heap_blks_scanned,
       heap_blks_vacuumed, index_vacuum_count,
       round(heap_blks_scanned::numeric/NULLIF(heap_blks_total,0)*100,1) AS pct_done
FROM pg_stat_progress_vacuum;
🚨 Never VACUUM FULL in Production Without a Maintenance Window VACUUM FULL rewrites the entire table to reclaim space at the OS level. It acquires ACCESS EXCLUSIVE lock - blocking all reads AND writes for the entire duration. On a 50GB table, this takes 30-90 minutes. Use `pg_repack` instead: it rewrites the table online using a trigger-based copy mechanism with only a brief final lock. Install: `apt install postgresql-13-repack`. Run: `pg_repack -U postgres -d myapp_db -t events`
Transactions & Isolation Levels in Practice
The difference between READ COMMITTED and REPEATABLE READ - with real-world examples of when each matters
Most applications use the default isolation level (READ COMMITTED) and never think about it. This is fine - until it isn’t. Understanding isolation levels is the difference between having subtle data integrity bugs that only appear under concurrent load and having none.
-- ═══ READ COMMITTED (default): each statement gets a fresh snapshot ═══
-- Real problem: inventory check + deduction in two statements
BEGIN;  -- Session A: processing order for item_id=1
SELECT quantity FROM inventory WHERE item_id = 1;  -- returns 1 (last item!)
-- Meanwhile, Session B runs:  UPDATE inventory SET quantity=0 WHERE item_id=1; COMMIT;
UPDATE inventory SET quantity = quantity - 1 WHERE item_id = 1;  -- now -1! oversold!
COMMIT;
-- READ COMMITTED saw quantity=1 on SELECT, but a fresh snapshot on UPDATE
-- The UPDATE is based on current data, so it correctly sees 0 and sets it to -1
-- Fix: Add a WHERE condition to catch this:
UPDATE inventory SET quantity = quantity - 1
  WHERE item_id = 1 AND quantity > 0;  -- returns 0 rows, application checks rowcount

-- ═══ REPEATABLE READ: one snapshot for the entire transaction ═══════
-- Real use case: generating a consistent report
SET TRANSACTION ISOLATION LEVEL REPEATABLE READ;
BEGIN;
SELECT sum(revenue) FROM orders WHERE month = '2024-01';
-- Other transactions commit new orders for Jan 2024 while you work
SELECT count(*) FROM orders WHERE month = '2024-01';
-- BOTH queries see the same snapshot → revenue and count are consistent
-- With READ COMMITTED: the count might include orders added after your sum!
COMMIT;

-- ═══ FOR UPDATE: the explicit row-level lock ═════════════════════════
-- Correct way to do "read and modify" atomically:
BEGIN;
SELECT quantity FROM inventory WHERE item_id = 1 FOR UPDATE;
-- This ROW is now LOCKED. Session B trying FOR UPDATE on same row will WAIT.
-- Session B trying plain SELECT will NOT wait (thanks MVCC)
UPDATE inventory SET quantity = quantity - 1 WHERE item_id = 1;
COMMIT;  -- lock released, Session B's FOR UPDATE proceeds

-- ═══ SKIP LOCKED: the job queue pattern ═════════════════════════════
-- 10 workers processing jobs from the same table without stepping on each other:
BEGIN;
SELECT id, payload
FROM jobs
WHERE status = 'pending'
ORDER BY priority DESC, created_at
LIMIT 1
FOR UPDATE SKIP LOCKED;
-- Worker 1 locks job 100, Worker 2 gets job 101, Worker 3 gets 102, etc.
-- Zero blocking, zero deadlocks. This is how modern job queues work.
-- Process the job, then:
UPDATE jobs SET status = 'processed' WHERE id = 100;
COMMIT;
Locking, Deadlocks & Blocking
Why ALTER TABLE kills your application - and how to safely do schema migrations on live tables
PostgreSQL has 8 lock modes ranging from ACCESS SHARE (SELECT) to ACCESS EXCLUSIVE (ALTER TABLE, DROP, VACUUM FULL). Most people don’t think about this until their migration script locks an entire table in production for 10 minutes while a heavy query waits.
The Lock Conflict Matrix That Matters in Practice
| Lock Mode | Acquired By | Blocks What | Danger Level |
|---|---|---|---|
| ACCESS SHARE | SELECT | Only ACCESS EXCLUSIVE | None |
| ROW EXCLUSIVE | INSERT, UPDATE, DELETE | SHARE, SHARE ROW EXCLUSIVE, EXCLUSIVE, ACCESS EXCLUSIVE | Low |
| SHARE UPDATE EXCLUSIVE | VACUUM, ANALYZE, CREATE INDEX CONCURRENTLY | Other SHARE UPDATE EXCLUSIVE and above | Low |
| ACCESS EXCLUSIVE | ALTER TABLE, DROP TABLE, VACUUM FULL, TRUNCATE | Everything - including SELECT | Critical |
The migration that locked production for 8 minutes
We ran what seemed like an innocent migration: ALTER TABLE events ADD COLUMN processed_at TIMESTAMPTZ DEFAULT NOW();. On PostgreSQL 13 with a 200M row table, this required a full table rewrite (PG 11+ only avoids rewrite if DEFAULT is NULL or a literal non-volatile value - NOW() is volatile). The migration acquired ACCESS EXCLUSIVE lock on the events table. Every SELECT, INSERT, and UPDATE on that table queued up waiting.
The first query to queue was a long-running dashboard query that had started 2 seconds before our migration. Because this query was holding a conflicting lock (ACCESS SHARE), our migration had to wait. But more critically: while our migration waited, EVERY new query trying to touch the events table also queued up behind it. Within 30 seconds, we had 200 queued queries, connection count hit 95/100, and the application started returning 500 errors.
The root cause was two things: (1) we didn’t add lock_timeout, so the migration waited forever; (2) the column default was NOW() not NULL, forcing a table rewrite.
How to Do Schema Migrations Safely
Step 1: Always set a lock_timeout on migrations: SET lock_timeout = '3s'; - if the lock can’t be acquired in 3 seconds, the migration fails instead of blocking everything. Step 2: For non-null defaults, add the column as NULL first, then set the default, then backfill in batches, then add the NOT NULL constraint. Step 3: For indexes, always use CREATE INDEX CONCURRENTLY - it uses SHARE UPDATE EXCLUSIVE instead of SHARE lock, allowing concurrent writes.
-- ═══ SAFE: Add column with NULL default (no rewrite) ════════
ALTER TABLE events ADD COLUMN processed_at TIMESTAMPTZ;  -- fast, NULL default

-- Then backfill in batches (don't lock the table for hours):
DO $$
DECLARE batch_size INT := 10000;
BEGIN
  LOOP
    UPDATE events
    SET processed_at = created_at
    WHERE id IN (
      SELECT id FROM events
      WHERE processed_at IS NULL
      LIMIT batch_size
    );
    EXIT WHEN NOT FOUND;
    PERFORM pg_sleep(0.05);  -- 50ms pause between batches
  END LOOP;
END $$;

-- ═══ SAFE: Create index without blocking writes ══════════════
CREATE INDEX CONCURRENTLY idx_events_processed_at
  ON events(processed_at)
  WHERE processed_at IS NOT NULL;
-- CONCURRENTLY does a multi-pass scan, takes longer but never blocks writes
-- NOTE: cannot run inside a transaction block

-- ═══ ALWAYS: Set lock_timeout on dangerous DDL ══════════════
SET lock_timeout = '3s';      -- fail if can't get lock in 3 seconds
SET statement_timeout = '120s'; -- fail if migration takes more than 2 minutes
ALTER TABLE events ADD CONSTRAINT events_user_fk
  FOREIGN KEY (user_id) REFERENCES users(id);

-- ═══ DIAGNOSE: Find current locks and blocking ═══════════════
SELECT
  blocked.pid AS blocked_pid,
  blocked.usename AS blocked_user,
  now() - blocked.query_start AS blocked_for,
  blocking.pid AS blocking_pid,
  blocking.usename AS blocking_user,
  now() - blocking.query_start AS blocking_for,
  left(blocked.query, 100) AS blocked_query,
  left(blocking.query, 100) AS blocking_query
FROM pg_stat_activity blocked
JOIN pg_locks bl ON bl.pid = blocked.pid AND NOT bl.granted
JOIN pg_locks bkl ON bkl.locktype = bl.locktype
  AND bkl.relation = bl.relation AND bkl.granted
JOIN pg_stat_activity blocking ON blocking.pid = bkl.pid
ORDER BY blocked_for DESC;
Configuration Tuning - Our pg-prod-01 Server
Every relevant setting explained with the actual value we should use - and why
PostgreSQL’s default configuration is intentionally conservative - it needs to run on a minimal machine. Our pg-prod-01 server has 8GB RAM, SSD storage, and runs TimescaleDB. Here’s the complete annotated configuration I’d apply.
# ═══════════════════════════════════════════════════════════════
# CONNECTIONS
# ═══════════════════════════════════════════════════════════════

# With PgBouncer, actual app connections are pooled to 5-10 PG connections
# Only monitoring tools, admin sessions, and replication need direct PG connections
max_connections = 30                    # was 100 - with PgBouncer, 30 is plenty
                                         # reduces shared memory overhead and proc array size
superuser_reserved_connections = 3      # always keep 3 connections for postgres superuser

# CRITICAL: kill sessions that leave transactions open and go idle
idle_in_transaction_session_timeout = 300000  # 5 minutes (was 0 = never!)

# Available in PG 14+: kills truly idle connections after 30 minutes
# idle_session_timeout = 1800000         # 30 minutes


# ═══════════════════════════════════════════════════════════════
# MEMORY
# ═══════════════════════════════════════════════════════════════

# 25% of RAM for the shared buffer cache (2GB on 8GB server = correct)
shared_buffers = '2GB'                 # ✓ already correct

# Tells planner about total cache (shared_buffers + OS page cache)
# Does NOT allocate memory - just influences planner decisions
# Higher = planner prefers index scans over seq scans for large tables
effective_cache_size = '6GB'            # ← ADD THIS (was missing!)

# Per-operation sort/hash buffer. With jemalloc and PgBouncer (few real connections)
# we can afford a bit more than 8MB. But don't go crazy - it's per-operation.
work_mem = '16MB'                      # was 8MB, can increase with fewer connections

# Used by VACUUM and CREATE INDEX - 256MB is good, 512MB makes index builds faster
maintenance_work_mem = '512MB'          # was 256MB

# Per-autovacuum-worker memory (set independently from maintenance_work_mem)
autovacuum_work_mem = '256MB'           # ← ADD THIS (default uses maintenance_work_mem)


# ═══════════════════════════════════════════════════════════════
# DISK / I/O (assuming SSD storage)
# ═══════════════════════════════════════════════════════════════

# SSD: random access ≈ sequential access. HDD default is 4.0 (4× penalty).
random_page_cost = 1.1                  # ← ADD THIS (was 4.0 - HDD default!)

# How many concurrent I/O requests PostgreSQL can issue (SSD: high, HDD: low)
effective_io_concurrency = 200          # ← ADD THIS (was 1 - HDD default!)
maintenance_io_concurrency = 10         # for VACUUM and CREATE INDEX


# ═══════════════════════════════════════════════════════════════
# WAL & CHECKPOINTS
# ═══════════════════════════════════════════════════════════════

# Spread checkpoint writes over 90% of interval → smoother I/O
# Default 0.5 causes bursty I/O spikes every few minutes
checkpoint_completion_target = 0.9     # ← ADD THIS

# Max WAL accumulation before forced checkpoint (increase for write-heavy)
max_wal_size = '4GB'                   # was 1GB
min_wal_size = '1GB'                   # keep at least 1GB of WAL for reuse
checkpoint_timeout = '10min'           # was 5min

# Compress WAL records (saves 30-50% WAL space, minimal CPU cost)
wal_compression = on                   # ← ADD THIS

# Enable checksums at initdb time (can't change after - prevents silent corruption)
# data_checksums = on                   # already set or not? check: pg_controldata | grep checksum


# ═══════════════════════════════════════════════════════════════
# QUERY PLANNING
# ═══════════════════════════════════════════════════════════════

# Default stats target (columns with complex distributions need more)
# Increase globally or per-column for better plans on skewed data
default_statistics_target = 100        # default, usually fine

# Enable JIT compilation for analytical queries (PG 11+)
# Disable if you have many small OLTP queries (JIT overhead hurts)
jit = on                               # default on in PG 13+

# Enable parallelism (TimescaleDB uses this)
max_parallel_workers_per_gather = 2    # use up to 2 workers per query
max_parallel_workers = 4               # total workers available
max_worker_processes = 12              # includes autovacuum, TimescaleDB workers


# ═══════════════════════════════════════════════════════════════
# LOGGING (add all of these - you'll thank yourself at 2am)
# ═══════════════════════════════════════════════════════════════

# Log all queries slower than 1 second
log_min_duration_statement = 1000

# Log what PostgreSQL is doing internally
log_checkpoints = on                   # see checkpoint timing and dirty page counts
log_connections = on                   # see new connections (audit trail)
log_disconnections = on                # see when connections close
log_lock_waits = on                    # log when lock wait exceeds deadlock_timeout
log_temp_files = 0                     # log any sort spilling to disk (work_mem too low)
log_autovacuum_min_duration = 250      # log autovacuum runs taking > 250ms

# Log line format - add remote host for debugging connection sources
log_line_prefix = '%m [%p] %q%u@%d %r '  # %r = remote host:port

# Auto-explain slow queries (log the EXPLAIN plan for slow queries automatically)
# shared_preload_libraries = 'timescaledb,pg_stat_statements,auto_explain'
# auto_explain.log_min_duration = '2s'
# auto_explain.log_analyze = on
# auto_explain.log_buffers = on


# ═══════════════════════════════════════════════════════════════
# SECURITY (our current config is INSECURE)
# ═══════════════════════════════════════════════════════════════

ssl = on                               # was off! Passwords and data sent in plaintext
password_encryption = scram-sha-256    # was md5 - SCRAM is much stronger

# Note: after changing password_encryption, existing user passwords must be
# reset: ALTER ROLE username PASSWORD 'newpassword';


# ═══════════════════════════════════════════════════════════════
# TIMESCALEDB
# ═══════════════════════════════════════════════════════════════

# TimescaleDB creates many chunks, each needing lock table entries
max_locks_per_transaction = 256        # ✓ already set correctly for TimescaleDB

# Libraries that must load at startup (order matters for timescaledb)
shared_preload_libraries = 'timescaledb,pg_stat_statements'  # ← ADD pg_stat_statements
PgBouncer - The Bugs in Our Config
Transaction pooling, auth setup, and the three dangerous settings in our pgbouncer.ini
We had PgBouncer running. We thought we were using it. We weren’t - or at least, not correctly. The app was still making direct connections to port 5432 in several codepaths, and the PgBouncer config itself had serious issues that would have caused problems under higher load.
How Transaction Mode Pooling Works (and Its Limitations)
Our PgBouncer is configured in transaction mode - the best setting for most web applications. Here’s what happens to a connection in this mode:
App opens connection to PgBouncer port 6432:
  PgBouncer maintains a client connection (lightweight, ~2KB)
  NO PostgreSQL backend process created yet

App sends: BEGIN; SELECT ...; UPDATE ...; COMMIT;
  PgBouncer sees BEGIN → borrows a PG connection from the pool
  All statements until COMMIT use the SAME PG connection
  PgBouncer sees COMMIT → returns the PG connection to the pool
  The PG backend is now available for another client

App sends: SELECT * FROM users WHERE id = 1;  (autocommit)
  PgBouncer borrows PG connection for the duration of this one statement
  Statement executes, result returned
  PgBouncer immediately returns PG connection to pool

With 1000 app clients and transaction mode:
  → PgBouncer holds 1000 client sockets (cheap, event-driven)
  → Only 5-20 actual PG backend processes exist (based on concurrency)
  → Memory: 5-20 × 15MB = 75-300MB vs 1000 × 50MB = 50GB direct connections!

⚠️ Transaction mode restrictions (cannot use these):
  SET session_variable = value;  (session settings are lost between transactions)
  LISTEN / NOTIFY;               (must use session mode for this)
  Advisory locks (session-level); (transaction-level advisory locks work fine)
  Prepared statements (protocol-level prepared statements work, SQL ones don't)
  Temporary tables;              (cleared when connection returns to pool)
Our pgbouncer.ini - Line by Line Analysis
[databases]
* = host=xx.xx.xx.xx port=5432
# ↑ All databases proxied. OK, but the IP should be xx.xx.xx.xx if PgBouncer
#   is on the same server as PostgreSQL. Using public IP = unnecessary network hop.
# FIX: * = host=xx.xx.xx.xx port=5432

[pgbouncer]
pool_mode = transaction
# ✓ Correct - best mode for typical web apps

max_client_conn = 10000
# ✓ OK - PgBouncer is event-driven, can handle 10k client sockets cheaply

default_pool_size = 150
# ❌ PROBLEM! This says "open up to 150 PG connections per database"
#    But our PostgreSQL only allows 100 total connections (max_connections=100)
#    When PgBouncer tries to open connection 101, PostgreSQL says FATAL: sorry, too many clients
#    We're saved ONLY because max_db_connections=50 caps it. But it's confusing and risky.
# FIX: default_pool_size = 20   (more than enough with transaction mode)

min_pool_size = 20
# ↑ Keep 20 PG connections warm at all times - good for latency

reserve_pool_size = 5
reserve_pool_timeout = 10
# ↑ If client waits > 10s, use reserve pool. OK.

max_db_connections = 50
# ↑ This is what's saving us - caps total PG connections at 50 regardless of pool_size
#   With max_connections=30 on PG (after our fix), set this to 25

auth_type = trust
# ❌ CRITICAL SECURITY ISSUE!
#    trust means: accept any connection as any user with no password verification
#    If port 6432 is reachable from any machine on the network (it is), this is game over
#    Anyone can: psql -h your-server -p 6432 -U postgres -d myapp_db (no password!)
# FIX: auth_type = scram-sha-256
#      auth_file = /etc/pgbouncer/userlist.txt
#      (file format: "username" "SCRAM-SHA-256$..." )
# Generate hashed password: psql -c "SELECT passwd FROM pg_shadow WHERE usename='myuser';"

query_timeout = 120
# ↑ Kill queries running > 2 minutes. Good.

client_idle_timeout = 120
# ↑ Close idle client connections after 2 minutes. Good - prevents the idle RSS bloat.

idle_transaction_timeout = 60
# ↑ Kill connections idle inside a transaction after 60 seconds. Critical for preventing
#   the XID wraparound scenario we had. Keep this.

server_idle_timeout = 300
# ↑ Close PG backend connections idle for 5 minutes. Good - returns pool connections.

# ═══ MISSING SETTINGS TO ADD ═════════════════════════════════
server_connect_timeout = 15    # fail if PG doesn't respond in 15 seconds
server_login_retry = 5         # retry up to 5 times on connection failure
tcp_keepalive = 1              # detect dead connections faster
tcp_keepidle = 30              # start keepalive after 30s idle
tcp_keepintvl = 10             # probe every 10s
log_connections = 1            # log new connections
log_disconnections = 1         # log disconnections
stats_period = 60              # print stats every 60 seconds to log
Monitoring & Diagnostics - The Real Toolkit
Every SQL query I actually run when something breaks - organized by problem type
I’ve built up this set of queries over years of PostgreSQL incidents. They’re organized by the situation you’re trying to diagnose. Bookmark this section.
-- ════════════════════════════════════════════════════════════
-- SITUATION: "The database is slow" - run these first
-- ════════════════════════════════════════════════════════════

-- 1. What's currently running and for how long?
SELECT pid, usename, datname, state, wait_event_type, wait_event,
       now() - query_start AS duration,
       left(query, 200) AS query
FROM pg_stat_activity
WHERE state != 'idle' AND pid != pg_backend_pid()
ORDER BY now() - query_start DESC;
-- Look for: queries running for > 30s, anything with wait_event = 'Lock'

-- 2. Is anything being blocked?
SELECT count(*) FROM pg_stat_activity WHERE wait_event_type = 'Lock';
-- If > 0: run the lock blocking query from Section 10

-- 3. Connection count by state
SELECT state, count(*), pg_size_pretty(sum(query_mem)::bigint) AS approx_mem
FROM (
  SELECT state, 0 AS query_mem FROM pg_stat_activity
) sub GROUP BY state;
-- idle > 20 = too many idle connections, check if app uses PgBouncer
-- idle in transaction > 0 = potential blocker for vacuum

-- ════════════════════════════════════════════════════════════
-- SITUATION: "Disk is filling up fast"
-- ════════════════════════════════════════════════════════════

-- Which databases are biggest?
SELECT datname, pg_size_pretty(pg_database_size(datname)) AS size
FROM pg_database ORDER BY pg_database_size(datname) DESC;

-- What's the biggest in your database?
SELECT schemaname, relname,
       pg_size_pretty(pg_total_relation_size(relid)) AS total,
       pg_size_pretty(pg_relation_size(relid)) AS heap,
       pg_size_pretty(pg_indexes_size(relid)) AS indexes,
       pg_size_pretty(pg_total_relation_size(relid) - pg_relation_size(relid) - pg_indexes_size(relid)) AS toast
FROM pg_catalog.pg_statio_user_tables
ORDER BY pg_total_relation_size(relid) DESC LIMIT 20;

-- How much WAL is there?
SELECT count(*) AS wal_files,
       pg_size_pretty(sum(size)) AS total_wal_size
FROM pg_ls_waldir();

-- Inactive replication slots holding WAL (CRITICAL if any found)
SELECT slot_name, slot_type, active,
       pg_size_pretty(pg_wal_lsn_diff(pg_current_wal_lsn(), restart_lsn)) AS wal_retained
FROM pg_replication_slots;
-- active=false with large wal_retained = DROP THIS SLOT IMMEDIATELY
-- SELECT pg_drop_replication_slot('slot_name');

-- ════════════════════════════════════════════════════════════
-- SITUATION: "Queries are getting slower over time"
-- ════════════════════════════════════════════════════════════

-- Dead tuple ratio (table bloat indicator)
SELECT schemaname, relname, n_live_tup, n_dead_tup,
       round(n_dead_tup::numeric / NULLIF(n_live_tup,0) * 100, 1) AS dead_pct,
       last_autovacuum, last_autoanalyze,
       pg_size_pretty(pg_total_relation_size(relid)) AS size
FROM pg_stat_user_tables
WHERE n_live_tup > 10000
ORDER BY dead_pct DESC LIMIT 20;
-- dead_pct > 10% = run VACUUM ANALYZE tablename immediately
-- last_autovacuum = NULL on old large tables = autovacuum never ran = problem!

-- Cache hit ratio (should be > 99% in OLTP)
SELECT
  round(sum(heap_blks_hit)::numeric / NULLIF(sum(heap_blks_hit) + sum(heap_blks_read), 0) * 100, 2) AS table_hit_pct,
  round(sum(idx_blks_hit)::numeric / NULLIF(sum(idx_blks_hit) + sum(idx_blks_read), 0) * 100, 2) AS index_hit_pct
FROM pg_statio_user_tables;
-- < 95% = your working set doesn't fit in shared_buffers → increase shared_buffers or add RAM

-- Slow queries (requires pg_stat_statements)
SELECT
  round(total_exec_time::numeric, 2) AS total_ms,
  calls,
  round(mean_exec_time::numeric, 2) AS avg_ms,
  round(stddev_exec_time::numeric, 2) AS stddev_ms,
  round(rows::numeric / NULLIF(calls, 0), 1) AS rows_per_call,
  shared_blks_hit, shared_blks_read,
  left(query, 200) AS query
FROM pg_stat_statements
ORDER BY total_exec_time DESC
LIMIT 20;
-- Focus on total_ms (total time spent in this query type)
-- High shared_blks_read = disk I/O heavy = needs index or more shared_buffers
-- High stddev_ms = query performance is inconsistent = check locks/autovacuum

-- ════════════════════════════════════════════════════════════
-- SITUATION: "RAM is spiking, what's using it?"
-- ════════════════════════════════════════════════════════════

-- PostgreSQL connection memory (approximate)
SELECT pid, usename, datname, state,
       now() - backend_start AS conn_age,
       now() - state_change AS in_state_for,
       left(query, 100) AS last_query
FROM pg_stat_activity
WHERE state = 'idle'
  AND now() - state_change > interval '5 minutes'
ORDER BY state_change;
-- These idle connections may be holding memory due to glibc issue
-- Kill them: SELECT pg_terminate_backend(pid) FROM pg_stat_activity
--            WHERE state = 'idle' AND now() - state_change > interval '30 minutes';

-- Actual RSS per PostgreSQL process (requires Linux, run as postgres user)
-- $ ps aux | grep 'postgres:' | awk '{sum += $6} END {print sum/1024 " MB total"}'
Backup & Point-in-Time Recovery
pg_dump is not enough - setting up real WAL archiving and PITR
For years, our backup strategy was a daily pg_dump cron job. That means: if something goes wrong at 4pm, we lose everything since midnight. With WAL archiving enabled, we can recover to any point in time - 4pm, 3:47pm, the moment before someone ran DROP TABLE.
# ═══ STEP 1: Enable WAL archiving (postgresql.conf) ══════════
archive_mode = on
archive_command = 'test ! -f /backup/wal/%f && cp %p /backup/wal/%f'
# %p = full path to WAL file being archived
# %f = just the filename
# The 'test ! -f' prevents overwriting existing files

# Or with S3 (better for production):
archive_command = 'aws s3 cp %p s3://my-postgres-backups/wal/%f'
# Requires aws-cli configured with appropriate IAM permissions
# WARNING: restart required to enable archive_mode

# ═══ STEP 2: Configure restore_command (for recovery) ════════
# (This is used during recovery, add to postgresql.conf or recovery.conf)
restore_command = 'cp /backup/wal/%f %p'
# Or from S3:
restore_command = 'aws s3 cp s3://my-postgres-backups/wal/%f %p'

# ═══ STEP 3: Schedule base backups (cron) ════════════════════
# Add to crontab (postgres user):
# 0 2 * * * pg_basebackup -U replicator -h 127.0.0.1 -Ft -z -D /backup/base/$(date +%Y%m%d) -Xs -P

# ═══ STEP 4: Point-in-Time Recovery procedure ════════════════
# Scenario: Someone ran DELETE FROM events WHERE created_at > '2024-03-10'
# at 14:37:22 UTC on March 10, 2024. We want to recover to 14:37:20.

# 1. Stop PostgreSQL
systemctl stop postgresql@13-main

# 2. Backup current data directory (just in case)
mv /var/lib/postgresql/13/main /var/lib/postgresql/13/main.broken

# 3. Restore the base backup closest to (before) our target time
mkdir /var/lib/postgresql/13/main
tar -xzf /backup/base/20240310/base.tar.gz -C /var/lib/postgresql/13/main
chown -R postgres:postgres /var/lib/postgresql/13/main

# 4. Configure recovery in postgresql.conf
cat >> /var/lib/postgresql/13/main/postgresql.conf << EOF
restore_command = 'cp /backup/wal/%f %p'
recovery_target_time = '2024-03-10 14:37:20 UTC'
recovery_target_action = 'promote'
EOF

# 5. Create the recovery signal file (PG 12+)
touch /var/lib/postgresql/13/main/recovery.signal

# 6. Start PostgreSQL - it will replay WAL up to the target time
systemctl start postgresql@13-main

# 7. Monitor recovery progress:
# tail -f /var/log/postgresql/postgresql-13-main.log
# LOG: starting point-in-time recovery to 2024-03-10 14:37:20+00
# LOG: restored log file "000000010000000000000001" from archive
# LOG: recovery stopping before commit of transaction 12345678, time 2024-03-10 14:37:23
# LOG: pausing at the end of recovery
# LOG: database system is ready to accept read only connections

# 8. Verify data looks correct, then promote:
# SELECT pg_promote();
# Database is now writable, recovery signal file removed automatically
⚠️ pg_dump Alone Is Not a Real Backup Strategy for Production pg_dump gives you a consistent snapshot but means you lose all data since the last dump (typically 24 hours). WAL archiving + base backups gives you RPO (recovery point objective) of seconds, not hours. For pg-prod-01 with TimescaleDB data - if this is production data you care about - set up WAL archiving today. Storage for WAL is cheap (compressed WAL for most workloads is under 5GB/day). The alternative is explaining to your users why you lost a full day of their data.
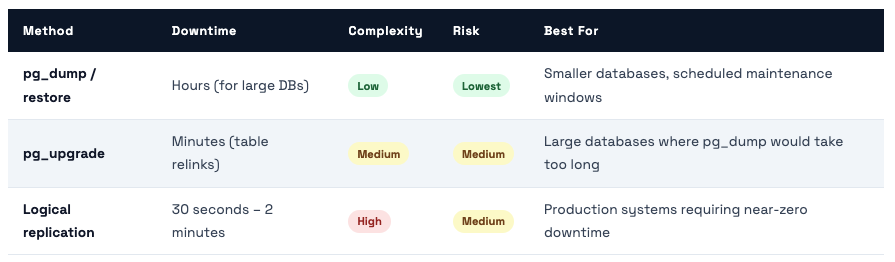
Upgrade Path - PostgreSQL 13 is Already EOL
Three ways to upgrade with different downtime tradeoffs - and what changed in PG 14, 15, 16, 17
PostgreSQL 13 reached end-of-life in November 2025. We’re now past that date. Every day we run PG 13 in production is a day we accept unpatched security vulnerabilities. Here’s how to upgrade without destroying your data or accepting unnecessary downtime.
# ═══ OVERVIEW: PG 13 (source) → PG 16 (target) ══════════════
# Source: pg-prod-01 (existing PG 13 server, port 5432)
# Target: new server (PG 16, port 5432)
# Estimated downtime: 30 seconds for connection string cutover

# ═══ SOURCE (PG 13): Prepare for logical replication ═════════
# postgresql.conf must have:
wal_level = logical          # (requires restart if not already set)
max_replication_slots = 5
max_wal_senders = 10

# pg_hba.conf: allow replication from new server
host  replication  replicator  NEW_SERVER_IP/32  scram-sha-256

# Create replication user
CREATE ROLE replicator WITH REPLICATION LOGIN PASSWORD 'strong-password-here';
GRANT SELECT ON ALL TABLES IN SCHEMA public TO replicator;

# Create publication for all tables
CREATE PUBLICATION upgrade_pub FOR ALL TABLES;

# ═══ TARGET (PG 16): Create identical schema ═════════════════
# Dump schema only from PG 13 (no data):
pg_dump -U postgres -h SOURCE_IP -s -f schema_only.sql mrcloudbook
# Apply to PG 16:
psql -U postgres -d myapp_db -f schema_only.sql

# Create subscription (this triggers initial data copy)
CREATE SUBSCRIPTION upgrade_sub
  CONNECTION 'host=SOURCE_IP dbname=myapp_db user=replicator password=strong-password-here'
  PUBLICATION upgrade_pub;

# ═══ MONITOR INITIAL SYNC ════════════════════════════════════
# On target PG 16:
SELECT subname, pid, relid::regclass AS table_name, phase,
       round(tuples_percent::numeric, 1) AS pct
FROM pg_stat_subscription_stats;
-- Wait for all tables to reach phase = 'streaming'
-- Large tables (50M rows) take 1-3 hours for initial copy

# ═══ CUTOVER (when ready) ════════════════════════════════════
# 1. Check replication lag is < 1 second:
SELECT now() - pg_last_xact_replay_timestamp() AS lag;  -- on subscriber

# 2. Put source into read-only mode (brief maintenance window):
ALTER DATABASE mrcloudbook SET default_transaction_read_only = on;

# 3. Wait for lag to hit 0:
SELECT count(*) FROM pg_stat_replication;  -- monitor on source

# 4. Promote target (stop replication, make writable):
DROP SUBSCRIPTION upgrade_sub;  -- on target, disconnects from source

# 5. Update PgBouncer connection string to point to new PG 16 server
# 6. Reload PgBouncer: psql -p 6432 pgbouncer -c 'RELOAD'
# Total downtime: ~15-30 seconds for steps 4-6
Key Features That Make PG 16 Worth Upgrading To
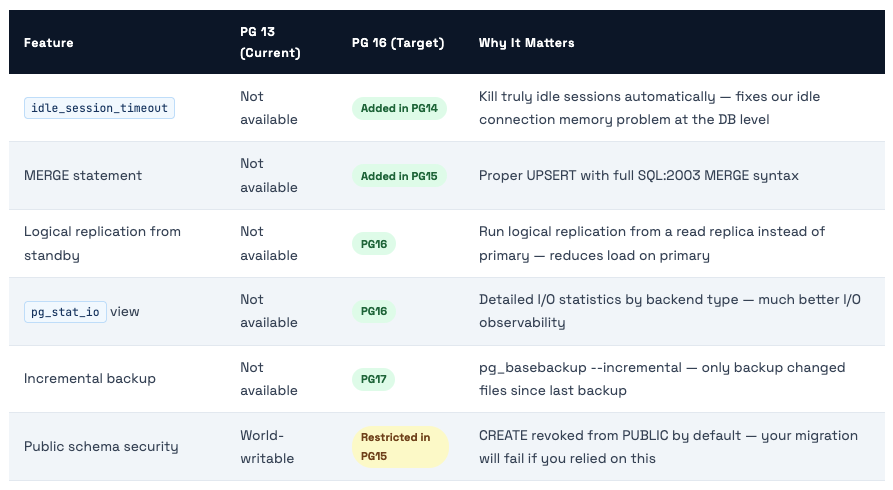
🚨 PG 15+ Breaking Change: Public Schema Permissions In PostgreSQL 15+, the CREATE privilege on the public schema is revoked from PUBLIC by default. If your application creates objects (tables, functions, sequences) in the public schema and connects as a non-superuser, your app will break after upgrading to PG 15+. Fix: GRANT CREATE ON SCHEMA public TO app_user; after upgrade. Test this thoroughly before cutting over production.
PostgreSQL 14 → 18: Every Feature That Matters & What Problem It Solves
What PostgreSQL 13 Was Missing That Hurt You Daily
These are the real operational gaps in PG13 that the community fixed in versions 14-18. If you’ve experienced any of these, that’s why.

PostgreSQL 14 - The Operational Relief Release
PG14’s most celebrated addition was the one that solved a problem everyone had: idle connections eating memory forever. It also brought major connection scalability improvements, better JSON subscripting, and LZ4 compression for TOAST and WAL.

PostgreSQL 15 - SQL Standards & Security Hardening
PG15’s headline was the SQL standard MERGE statement, finally bringing proper UPSERT to PostgreSQL. But the change that caught most people off-guard was the security hardening of the public schema - it broke a lot of applications that assumed any user could create objects there.
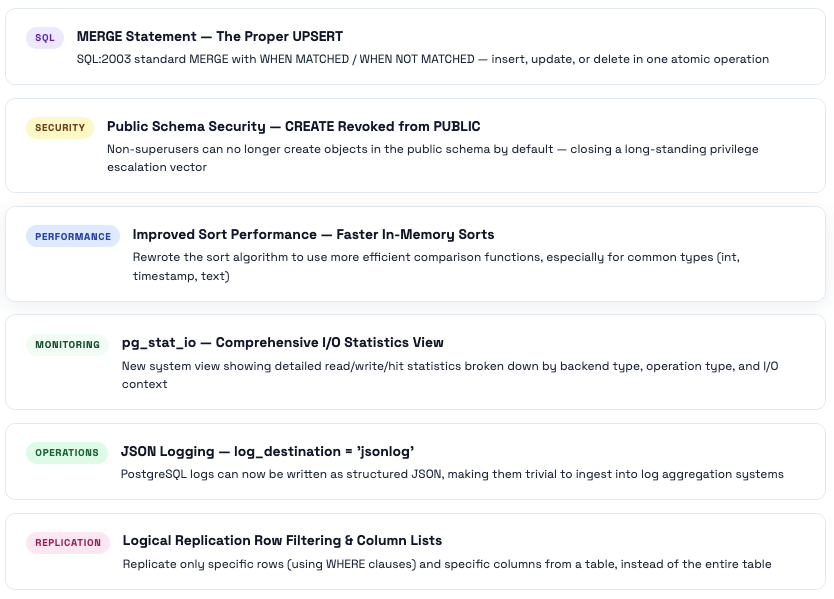
PostgreSQL 16 - Parallelism, Replication Flexibility & Security
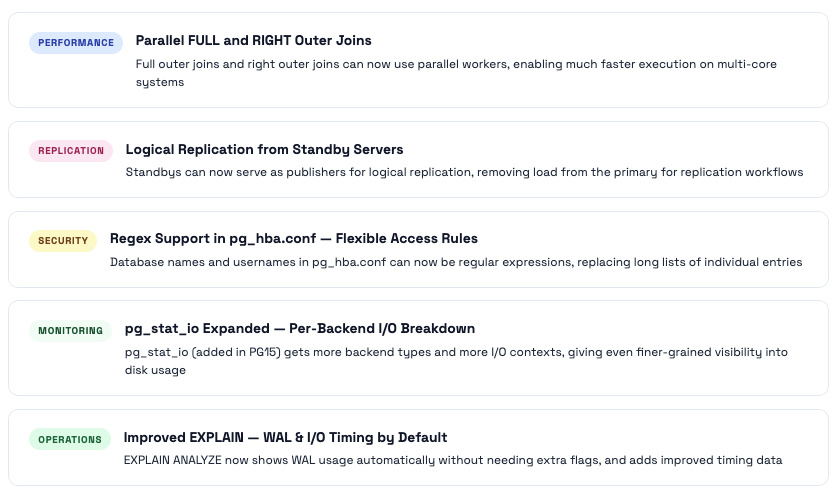
PG16 expanded parallelism (FULL and RIGHT outer joins can now use parallel workers), made the pg_hba.conf much more flexible with regex support, and importantly allowed standbys to serve as logical replication publishers - reducing load on primary servers in high-availability setups.
PostgreSQL 17 - The Operational Excellence Release
PG17 is arguably the most operationally significant release since PG13. The VACUUM overhaul alone (20× less memory, no 1GB cap) is worth upgrading for. Add incremental backups, doubled write throughput, JSON_TABLE, and better replication slot management, and this becomes a compelling upgrade from any version.
⭐ The Flagship Feature: VACUUM Gets a Complete Overhaul
PostgreSQL 17 replaced the old array-based dead tuple tracking structure in VACUUM with a new structure called TidStore. The results are dramatic:
- Up to 20× reduction in VACUUM memory usage - a table that previously required 1GB for VACUUM now might need 50MB
- The 1GB memory cap is gone - previously VACUUM would stop collecting dead tuples at 1GB and do multiple passes; now it processes everything in one efficient pass
- WAL traffic from VACUUM is more compact - the new structure generates less WAL during freeze operations
- Index cleanup is faster - TidStore-based dead tuple collection makes index entry removal more efficient
Real-world impact: If you had autovacuum running with maintenance_work_mem = 256MB, it could only track 256MB / 6 bytes ≈ 44 million dead tuples before stopping. With TidStore, 256MB of memory can track many more dead tuples because the structure compresses ranges of contiguous TIDs. Large tables with millions of dead tuples get cleaned in a single pass instead of multiple passes.
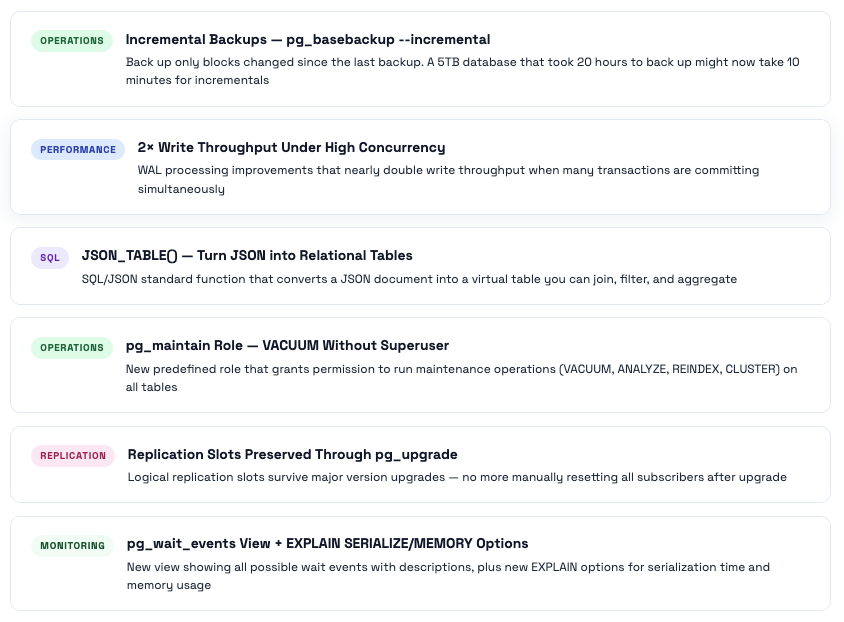
PostgreSQL 18 - The Architecture Revolution
PostgreSQL 18 is the most architecturally significant release in years. The async I/O subsystem alone delivers 3× read performance. But it’s the combination of async I/O, UUIDv7, virtual generated columns, OLD/NEW in RETURNING, skip scan, and statistics-preserving pg_upgrade that makes this release feel like PostgreSQL grew up to meet modern hardware and modern development practices simultaneously.
⭐ The Biggest Feature in Years: Asynchronous I/O Subsystem
The problem: Every version of PostgreSQL before 18 issued disk reads one at a time. When reading 1000 pages for a sequential scan, it would ask for page 1, wait for it to arrive, ask for page 2, wait, ask for page 3, wait. Even on NVMe SSDs capable of 1 million concurrent IOPS, PostgreSQL was using a tiny fraction of that capability because it couldn’t issue multiple concurrent read requests.
The solution: PG18’s async I/O (AIO) subsystem allows backends to queue multiple read requests simultaneously. Instead of “read page 1, wait, read page 2, wait”, it now does “read pages 1-128 simultaneously, process as they arrive.” This is called prefetching and it maps directly to how modern OS and NVMe hardware work.
- Sequential scans: up to 3× faster - the most impacted operation
- Bitmap heap scans: significantly faster - these read random pages from a set, ideal for async
- VACUUM: faster because the heap scanning phase can prefetch pages ahead
- CREATE INDEX: faster because it reads the full heap to build the index
- Controlled by: io_method parameter. Default is sync (old behavior). Set to worker or io_uring (Linux only) to enable async I/O.
# PG18 io_method options:
io_method = sync      # default - old synchronous behavior
io_method = worker    # async via background worker threads (portable, all platforms)
io_method = io_uring  # async via Linux io_uring (fastest, Linux 5.1+ only)

# Recommended for modern Linux servers with NVMe storage:
io_method = 'io_uring'           # requires Linux kernel 5.1+

# Check your kernel version: uname -r
# On DigitalOcean/Ubuntu 22.04: typically 5.15+ → io_uring works

# io_uring defaults changed in PG18: effective_io_concurrency default raised to 16
# (was 1 in PG13 - reflecting modern hardware better)
effective_io_concurrency = 200   # for SSD (leave at 16 for HDD)
maintenance_io_concurrency = 16  # for VACUUM, ANALYZE, CREATE INDEX
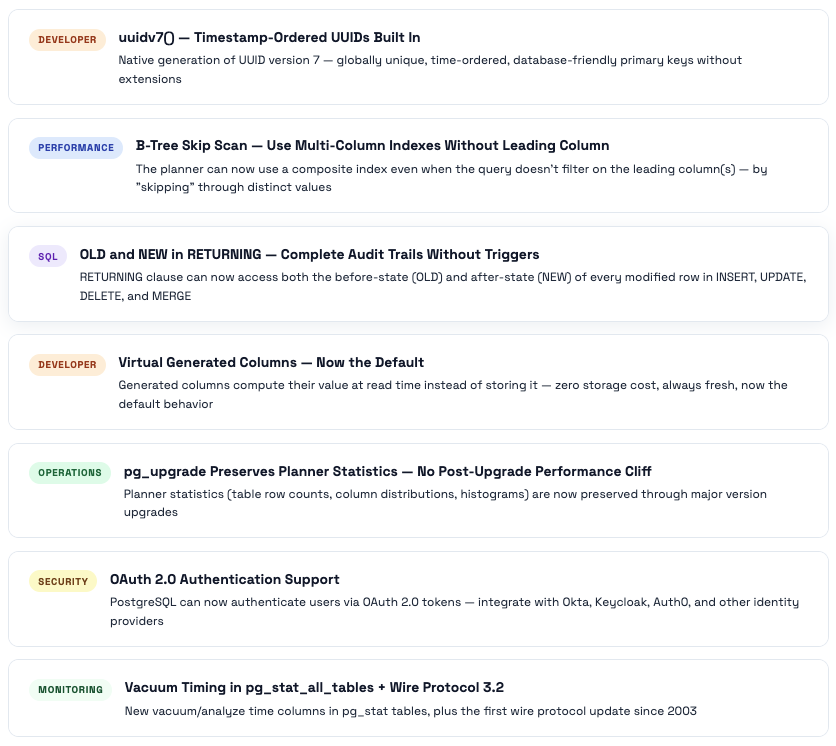
Comments (0)
No comments yet. Be the first to share your thoughts.
Leave a comment